\n
## Grouped Bar Chart: Model Performance Comparison Across Three Tasks
### Overview
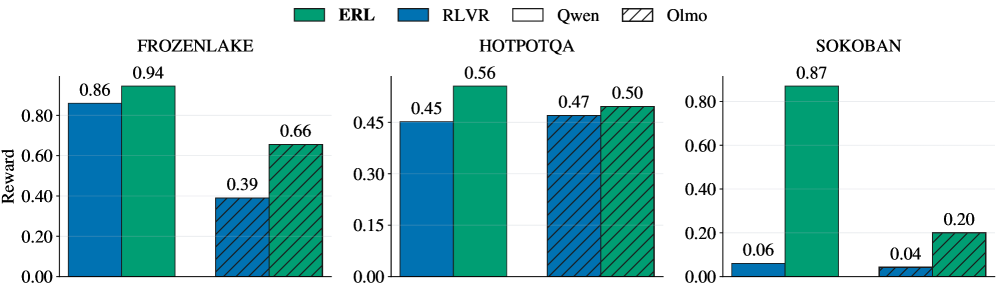
The image displays a grouped bar chart comparing the performance (measured in "Reward") of four different models—ERL, RLVR, Qwen, and Olmo—across three distinct tasks or environments: FROZENLAKE, HOTPOTQA, and SOKOBAN. The chart is divided into three separate panels, one for each task.
### Components/Axes
* **Legend:** Located at the top center of the entire figure. It defines the four data series:
* **ERL:** Solid green bar.
* **RLVR:** Solid blue bar.
* **Qwen:** White bar with a black outline.
* **Olmo:** Hatched bar (diagonal lines) with a green outline.
* **Y-Axis (Common to all panels):** Labeled "Reward". The scale runs from 0.00 to approximately 0.90, with major tick marks at 0.00, 0.20, 0.40, 0.60, and 0.80. The exact upper limit varies slightly per panel to accommodate the data.
* **X-Axis (Per Panel):** Each panel represents a task, labeled at the top: "FROZENLAKE", "HOTPOTQA", and "SOKOBAN". Within each panel, four bars are grouped together, corresponding to the four models in the legend order (RLVR, ERL, Qwen, Olmo from left to right).
* **Data Labels:** Numerical values are printed directly above each bar, indicating the precise reward score.
### Detailed Analysis
**Panel 1: FROZENLAKE**
* **RLVR (Blue):** Reward = 0.86
* **ERL (Green):** Reward = 0.94 (Highest in this task)
* **Qwen (White):** Reward = 0.39
* **Olmo (Hatched):** Reward = 0.66
* **Trend:** ERL performs best, followed by RLVR. There is a significant drop-off for Qwen and Olmo, with Qwen scoring the lowest.
**Panel 2: HOTPOTQA**
* **RLVR (Blue):** Reward = 0.45
* **ERL (Green):** Reward = 0.56 (Highest in this task)
* **Qwen (White):** Reward = 0.47
* **Olmo (Hatched):** Reward = 0.50
* **Trend:** Performance is much more tightly clustered compared to FROZENLAKE. ERL again leads, but the margins are smaller. RLVR is the lowest performer here.
**Panel 3: SOKOBAN**
* **RLVR (Blue):** Reward = 0.06
* **ERL (Green):** Reward = 0.87 (Highest in this task)
* **Qwen (White):** Reward = 0.04
* **Olmo (Hatched):** Reward = 0.20
* **Trend:** ERL demonstrates dominant performance, achieving a reward score over 20 times higher than the next best model (Olmo). RLVR and Qwen show near-zero performance.
### Key Observations
1. **Consistent Leader:** The ERL model (green bar) achieves the highest reward score in all three tasks (0.94, 0.56, 0.87).
2. **Task-Dependent Performance:** The relative ranking and absolute performance of the other models (RLVR, Qwen, Olmo) vary dramatically by task. For example, RLVR is the second-best in FROZENLAKE (0.86) but the worst in HOTPOTQA (0.45).
3. **Extreme Disparity in SOKOBAN:** The SOKOBAN task shows the most extreme performance gap, with ERL excelling while the other three models fail almost completely (scores ≤ 0.20).
4. **Clustering in HOTPOTQA:** The HOTPOTQA task shows the most competitive and clustered results, with all models scoring between 0.45 and 0.56.
### Interpretation
This chart suggests that the **ERL model is robust and generalizes well** across diverse task types (a grid-world navigation task like FROZENLAKE, a question-answering task like HOTPOTQA, and a planning/puzzle task like SOKOBAN). Its performance is not only consistently high but also dominant in two of the three domains.
The performance of the other models is **highly task-specific**. This indicates that their underlying architectures or training may be specialized or lack the flexibility to handle different problem structures. The near-failure of RLVR, Qwen, and Olmo on SOKOBAN is particularly notable, suggesting this task requires a specific capability (e.g., long-horizon planning, spatial reasoning) that ERL possesses but the others lack.
From a technical evaluation perspective, this data would argue strongly for the superiority of the ERL approach in the tested environments. The stark contrast in SOKOBAN could be a key area for investigating the specific algorithmic or representational advantages of ERL.