## Line Graph: Head Proportions through Global RMS Selection By Target Ratio
### Overview
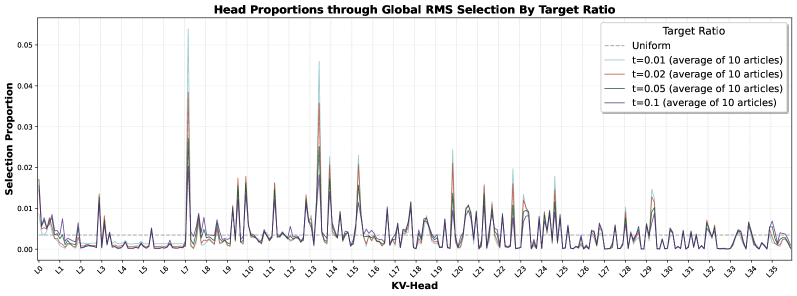
The graph illustrates the relationship between KV-Head layers (L0–L35) and selection proportions under varying target ratios (t=0.01, 0.02, 0.05, 0.1) compared to a uniform baseline. Four lines represent different target ratios, with peaks indicating localized increases in selection proportion.
### Components/Axes
- **X-Axis (KV-Head)**: Labeled "KV-Head" with discrete markers L0 to L35 (likely representing layers or levels).
- **Y-Axis (Selection Proportion)**: Ranges from 0.00 to 0.05 in increments of 0.01.
- **Legend**: Positioned in the top-right corner, mapping colors to target ratios:
- Dashed gray: Uniform (baseline)
- Light blue: t=0.01 (average of 10 articles)
- Red: t=0.02 (average of 10 articles)
- Green: t=0.05 (average of 10 articles)
- Purple: t=0.1 (average of 10 articles)
### Detailed Analysis
- **Uniform Baseline (Dashed Gray)**: Remains flat near 0.005 across all L levels, serving as a reference.
- **t=0.01 (Light Blue)**: Peaks at L7 (~0.045), with minor fluctuations. Selection proportion drops sharply after L7.
- **t=0.02 (Red)**: Peaks at L14 (~0.048), with a secondary peak at L21 (~0.042). Higher magnitude than t=0.01.
- **t=0.05 (Green)**: Peaks at L21 (~0.045), with a secondary peak at L28 (~0.04). Broader spread than t=0.02.
- **t=0.1 (Purple)**: Peaks at L28 (~0.038), with a secondary peak at L35 (~0.032). Lower magnitude than t=0.05 but wider distribution.
### Key Observations
1. **Peak Correlation**: Higher target ratios (t=0.05, 0.1) exhibit peaks at later L levels (L21, L28, L35) compared to lower ratios (t=0.01, 0.02).
2. **Magnitude Trends**: Peaks for t=0.02 and t=0.05 are the highest (~0.048), while t=0.1 has the lowest peak (~0.038).
3. **Secondary Peaks**: All lines show secondary peaks at later L levels, suggesting sustained selection activity.
4. **Baseline Stability**: The uniform line remains consistently flat, indicating no selection bias without target ratios.
### Interpretation
The data suggests that increasing the target ratio correlates with selection proportion peaking at higher KV-Head layers. This implies a hierarchical selection mechanism where larger target ratios engage deeper layers. The uniform baseline confirms that selection proportions are not inherently biased toward specific layers. The secondary peaks may indicate iterative refinement or cascading selection effects. Notably, t=0.1’s lower peak magnitude despite its higher ratio suggests diminishing returns at extreme target values. The sharp drops post-peak could reflect saturation or threshold-based selection criteria.