## Line Chart: Experienced Items Ratio vs. Environment Step
### Overview
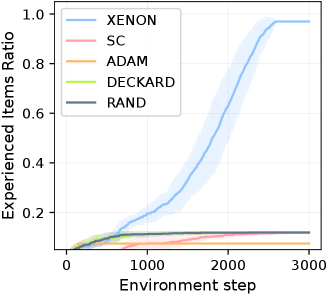
The image is a line chart comparing the performance of five different methods or algorithms over the course of 3000 environment steps. The performance metric is the "Experienced Items Ratio." One method, XENON, shows a dramatic, near-sigmoidal increase in performance, while the other four methods (SC, ADAM, DECKARD, RAND) show minimal to no improvement, remaining near the baseline.
### Components/Axes
* **Chart Type:** Line chart with shaded confidence intervals/variance bands.
* **Y-Axis:**
* **Label:** "Experienced Items Ratio"
* **Scale:** Linear, from 0.0 to 1.0.
* **Major Ticks:** 0.0, 0.2, 0.4, 0.6, 0.8, 1.0.
* **X-Axis:**
* **Label:** "Environment step"
* **Scale:** Linear, from 0 to 3000.
* **Major Ticks:** 0, 1000, 2000, 3000.
* **Legend:** Located in the top-left corner of the plot area. It contains five entries, each with a colored line sample and a text label.
1. **XENON:** Light blue line.
2. **SC:** Pink line.
3. **ADAM:** Orange line.
4. **DECKARD:** Light green line.
5. **RAND:** Gray line.
### Detailed Analysis
**Data Series Trends and Approximate Values:**
1. **XENON (Light Blue Line):**
* **Trend:** Starts near 0.0. Shows a slow, steady increase until approximately step 1500. After step 1500, the slope increases dramatically, exhibiting a steep, nearly linear rise until about step 2500. The growth then decelerates, approaching an asymptote near 1.0 by step 3000. A light blue shaded region surrounds the line, indicating variance or a confidence interval, which widens during the period of steepest ascent (steps ~1500-2500).
* **Approximate Data Points:**
* Step 0: ~0.0
* Step 1000: ~0.1
* Step 1500: ~0.2
* Step 2000: ~0.6
* Step 2500: ~0.95
* Step 3000: ~0.98
2. **SC (Pink Line):**
* **Trend:** Remains very low and flat throughout. Shows a very slight, gradual increase from near 0.0 to approximately 0.1 over 3000 steps.
* **Approximate Data Points:** Hovers between 0.0 and 0.1 for the entire duration.
3. **ADAM (Orange Line):**
* **Trend:** Similar to SC, remains very low and flat. It appears to be the lowest-performing method for most of the timeline, ending slightly above 0.0.
* **Approximate Data Points:** Consistently near or just above 0.0.
4. **DECKARD (Light Green Line):**
* **Trend:** Remains low and flat, with a slight initial rise in the first 500 steps before plateauing. It performs slightly better than ADAM and SC for most of the chart.
* **Approximate Data Points:** Plateaus around 0.05 to 0.08 after step 500.
5. **RAND (Gray Line):**
* **Trend:** Remains low and flat, closely tracking the performance of DECKARD and SC. It shows minimal growth.
* **Approximate Data Points:** Hovers around 0.05 to 0.1, similar to DECKARD and SC.
### Key Observations
1. **Dominant Performance:** The XENON method is the clear outlier, demonstrating a capability to achieve a high "Experienced Items Ratio" (approaching 1.0 or 100%) that the other methods fail to achieve.
2. **Phase Transition:** XENON's performance exhibits a distinct phase transition around step 1500, shifting from slow growth to rapid, sustained improvement.
3. **Baseline Cluster:** SC, ADAM, DECKARD, and RAND form a tight cluster of low performance, all remaining below a ratio of 0.2. Their relative ordering is not strongly differentiated.
4. **Variance:** The shaded blue area indicates that the XENON method's performance has higher variance or uncertainty during its rapid growth phase compared to its stable start and end points. The other methods show negligible visible variance.
### Interpretation
This chart likely comes from a machine learning or reinforcement learning context, comparing different exploration or experience-gathering strategies. The "Experienced Items Ratio" probably measures the proportion of a state space, object set, or task repertoire that an agent has encountered.
* **What the data suggests:** The XENON strategy is fundamentally more effective at systematically discovering and experiencing novel items/states over time. Its sigmoidal curve suggests a process that starts slowly (perhaps building a foundational model), then hits a "tipping point" where discovery accelerates rapidly, and finally saturates as it exhausts the available items.
* **How elements relate:** The stark contrast between XENON and the cluster of other methods (including RAND, which likely represents random exploration) implies that XENON employs a non-random, directed, and highly efficient exploration mechanism. The other methods appear no more effective than random chance or simple heuristics for this specific metric.
* **Notable Anomalies:** The most significant anomaly is the performance gap itself. The fact that four methods cluster near the bottom while one soars suggests a qualitative difference in approach, not just a quantitative tuning. The widening variance band for XENON during its ascent is also notable, indicating that while the *average* performance rises sharply, individual runs or episodes may have more variable discovery rates during this critical learning phase.
**Language:** All text in the image is in English.