## Chart: Naming Accuracy vs. Decomposition Accuracy
### Overview
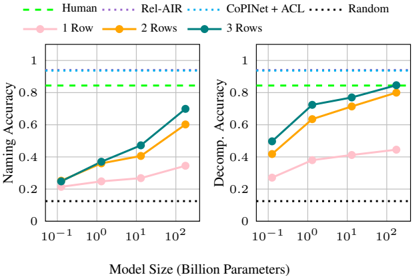
The image presents two line charts comparing the naming accuracy and decomposition accuracy of different models against model size. The x-axis represents the model size in billion parameters, using a logarithmic scale. The y-axis represents the accuracy, ranging from 0 to 1. The charts compare the performance of models with 1, 2, and 3 rows, along with baselines for Human, Rel-AIR, CoPINet + ACL, and Random.
### Components/Axes
* **X-axis (Model Size):** Logarithmic scale, labeled "Model Size (Billion Parameters)". Markers at 10<sup>-1</sup>, 10<sup>0</sup>, 10<sup>1</sup>, and 10<sup>2</sup>.
* **Y-axis (Left Chart):** Linear scale, labeled "Naming Accuracy". Markers at 0, 0.2, 0.4, 0.6, 0.8, and 1.
* **Y-axis (Right Chart):** Linear scale, labeled "Decomp. Accuracy". Markers at 0, 0.2, 0.4, 0.6, 0.8, and 1.
* **Legend (Top):**
* Green dashed line: Human
* Purple dotted line: Rel-AIR
* Teal dotted line: CoPINet + ACL
* Black dotted line: Random
* Pink line: 1 Row
* Orange line: 2 Rows
* Teal line: 3 Rows
### Detailed Analysis
**Left Chart: Naming Accuracy**
* **Human (Green dashed line):** Constant at approximately 0.85.
* **Rel-AIR (Purple dotted line):** Constant at approximately 0.95.
* **CoPINet + ACL (Teal dotted line):** Constant at approximately 0.95.
* **Random (Black dotted line):** Constant at approximately 0.12.
* **1 Row (Pink line):** Slopes upward, starting at approximately 0.22 at 10<sup>-1</sup>, reaching approximately 0.25 at 10<sup>0</sup>, approximately 0.28 at 10<sup>1</sup>, and approximately 0.35 at 10<sup>2</sup>.
* **2 Rows (Orange line):** Slopes upward, starting at approximately 0.25 at 10<sup>-1</sup>, reaching approximately 0.38 at 10<sup>0</sup>, approximately 0.42 at 10<sup>1</sup>, and approximately 0.60 at 10<sup>2</sup>.
* **3 Rows (Teal line):** Slopes upward, starting at approximately 0.25 at 10<sup>-1</sup>, reaching approximately 0.38 at 10<sup>0</sup>, approximately 0.48 at 10<sup>1</sup>, and approximately 0.70 at 10<sup>2</sup>.
**Right Chart: Decomposition Accuracy**
* **Human (Green dashed line):** Constant at approximately 0.85.
* **Rel-AIR (Purple dotted line):** Constant at approximately 0.95.
* **CoPINet + ACL (Teal dotted line):** Constant at approximately 0.95.
* **Random (Black dotted line):** Constant at approximately 0.12.
* **1 Row (Pink line):** Slopes upward, starting at approximately 0.28 at 10<sup>-1</sup>, reaching approximately 0.30 at 10<sup>0</sup>, approximately 0.38 at 10<sup>1</sup>, and approximately 0.42 at 10<sup>2</sup>.
* **2 Rows (Orange line):** Slopes upward, starting at approximately 0.42 at 10<sup>-1</sup>, reaching approximately 0.62 at 10<sup>0</sup>, approximately 0.70 at 10<sup>1</sup>, and approximately 0.82 at 10<sup>2</sup>.
* **3 Rows (Teal line):** Slopes upward, starting at approximately 0.50 at 10<sup>-1</sup>, reaching approximately 0.72 at 10<sup>0</sup>, approximately 0.78 at 10<sup>1</sup>, and approximately 0.85 at 10<sup>2</sup>.
### Key Observations
* The accuracy of models with 1, 2, and 3 rows generally increases with model size for both naming and decomposition accuracy.
* The "Human", "Rel-AIR", and "CoPINet + ACL" baselines show constant accuracy across different model sizes.
* The "Random" baseline shows a consistently low accuracy.
* The 3-row model generally outperforms the 2-row model, which in turn outperforms the 1-row model.
* The decomposition accuracy is generally higher than the naming accuracy for the same model size and number of rows.
### Interpretation
The charts demonstrate that increasing the model size (number of parameters) generally improves both naming and decomposition accuracy for the models with 1, 2, and 3 rows. The performance gain is more significant for decomposition accuracy compared to naming accuracy. The models with more rows (3 rows) tend to perform better than those with fewer rows (1 or 2 rows). The "Human", "Rel-AIR", and "CoPINet + ACL" baselines provide a benchmark for the performance of these models, while the "Random" baseline indicates the expected performance of a model with no learning. The data suggests that increasing model size and the number of rows are effective strategies for improving the accuracy of these models, but there are diminishing returns as the model size increases.