## Charts: Naming Accuracy vs. Decomposition Accuracy by Model Size and Rows
### Overview
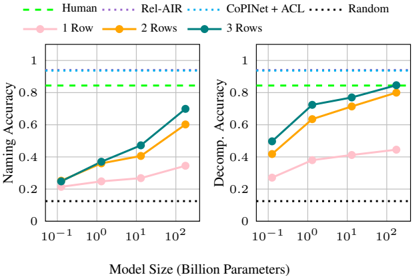
The image presents two line charts comparing the performance of different models (Human, Rel-AIR, CoPINet + ACL, and Random) on two tasks: Naming Accuracy and Decomposition Accuracy. Both charts share the same x-axis representing Model Size (in Billion Parameters) and vary by the number of Rows used (1, 2, or 3). The charts visually demonstrate how performance changes with increasing model size for each model and row configuration.
### Components/Axes
* **X-axis:** Model Size (Billion Parameters) - Scale is logarithmic: 10<sup>-1</sup>, 10<sup>0</sup>, 10<sup>1</sup>, 10<sup>2</sup>.
* **Left Chart Y-axis:** Naming Accuracy - Scale is linear from 0 to 1.
* **Right Chart Y-axis:** Decomposition Accuracy - Scale is linear from 0 to 1.
* **Legend:**
* Human (Green, dashed line)
* Rel-AIR (Purple line)
* CoPINet + ACL (Blue line)
* Random (Black, dotted line)
* **Data Series:**
* 1 Row (Pink, light shade)
* 2 Rows (Orange)
* 3 Rows (Dark Blue)
### Detailed Analysis or Content Details
**Left Chart: Naming Accuracy**
* **Human (Green, dashed):** Maintains a consistently high Naming Accuracy of approximately 0.95 across all model sizes.
* **Random (Black, dotted):** Maintains a consistently low Naming Accuracy of approximately 0.2 across all model sizes.
* **Rel-AIR (Purple):**
* At 10<sup>-1</sup> Billion Parameters: Approximately 0.22
* At 10<sup>0</sup> Billion Parameters: Approximately 0.35
* At 10<sup>1</sup> Billion Parameters: Approximately 0.52
* At 10<sup>2</sup> Billion Parameters: Approximately 0.65
* **CoPINet + ACL (Blue):**
* 1 Row (Pink):
* At 10<sup>-1</sup> Billion Parameters: Approximately 0.23
* At 10<sup>0</sup> Billion Parameters: Approximately 0.33
* At 10<sup>1</sup> Billion Parameters: Approximately 0.46
* At 10<sup>2</sup> Billion Parameters: Approximately 0.60
* 2 Rows (Orange):
* At 10<sup>-1</sup> Billion Parameters: Approximately 0.28
* At 10<sup>0</sup> Billion Parameters: Approximately 0.40
* At 10<sup>1</sup> Billion Parameters: Approximately 0.55
* At 10<sup>2</sup> Billion Parameters: Approximately 0.70
* 3 Rows (Dark Blue):
* At 10<sup>-1</sup> Billion Parameters: Approximately 0.32
* At 10<sup>0</sup> Billion Parameters: Approximately 0.45
* At 10<sup>1</sup> Billion Parameters: Approximately 0.60
* At 10<sup>2</sup> Billion Parameters: Approximately 0.75
**Right Chart: Decomposition Accuracy**
* **Human (Green, dashed):** Maintains a consistently high Decomposition Accuracy of approximately 0.9 across all model sizes.
* **Random (Black, dotted):** Maintains a consistently low Decomposition Accuracy of approximately 0.2 across all model sizes.
* **Rel-AIR (Purple):**
* At 10<sup>-1</sup> Billion Parameters: Approximately 0.55
* At 10<sup>0</sup> Billion Parameters: Approximately 0.65
* At 10<sup>1</sup> Billion Parameters: Approximately 0.75
* At 10<sup>2</sup> Billion Parameters: Approximately 0.85
* **CoPINet + ACL (Blue):**
* 1 Row (Pink):
* At 10<sup>-1</sup> Billion Parameters: Approximately 0.25
* At 10<sup>0</sup> Billion Parameters: Approximately 0.40
* At 10<sup>1</sup> Billion Parameters: Approximately 0.55
* At 10<sup>2</sup> Billion Parameters: Approximately 0.65
* 2 Rows (Orange):
* At 10<sup>-1</sup> Billion Parameters: Approximately 0.45
* At 10<sup>0</sup> Billion Parameters: Approximately 0.60
* At 10<sup>1</sup> Billion Parameters: Approximately 0.75
* At 10<sup>2</sup> Billion Parameters: Approximately 0.85
* 3 Rows (Dark Blue):
* At 10<sup>-1</sup> Billion Parameters: Approximately 0.50
* At 10<sup>0</sup> Billion Parameters: Approximately 0.65
* At 10<sup>1</sup> Billion Parameters: Approximately 0.80
* At 10<sup>2</sup> Billion Parameters: Approximately 0.90
### Key Observations
* **Model Size Impact:** For all models except Human and Random, performance (both Naming and Decomposition Accuracy) generally increases with increasing model size.
* **Rows Impact:** Increasing the number of rows consistently improves performance for CoPINet + ACL, with 3 rows generally outperforming 2 and 1 rows.
* **Human Performance:** Human performance is significantly higher than all other models on both tasks, indicating a performance ceiling.
* **Random Performance:** Random performance is consistently low, serving as a baseline.
* **Rel-AIR:** Rel-AIR shows a steady increase in performance with model size, but remains below Human performance.
### Interpretation
The data suggests that increasing model size generally leads to improved performance in both Naming and Decomposition tasks, particularly for the CoPINet + ACL model. The benefit of increasing the number of rows used in CoPINet + ACL indicates that the model benefits from more complex representations or contextual information. The consistently high performance of the Human baseline highlights the gap between current model capabilities and human-level performance. The low performance of the Random model confirms that the observed performance of other models is not due to chance. The charts demonstrate a clear trade-off between model complexity (size and row count) and performance, with diminishing returns as models approach human-level accuracy. The difference in performance between the two tasks (Naming vs. Decomposition) suggests that the models may have varying strengths and weaknesses in different aspects of language understanding.