# Technical Data Extraction: Control Effect Analysis (Layer 1)
This document provides a comprehensive extraction of data from a technical visualization consisting of eight line charts and one summary heatmap. The data explores the "Control effect (d)" across various "Target axes" and "Affected axes" (LR and Principal Components PC1 through PC512) as a function of the number of examples.
---
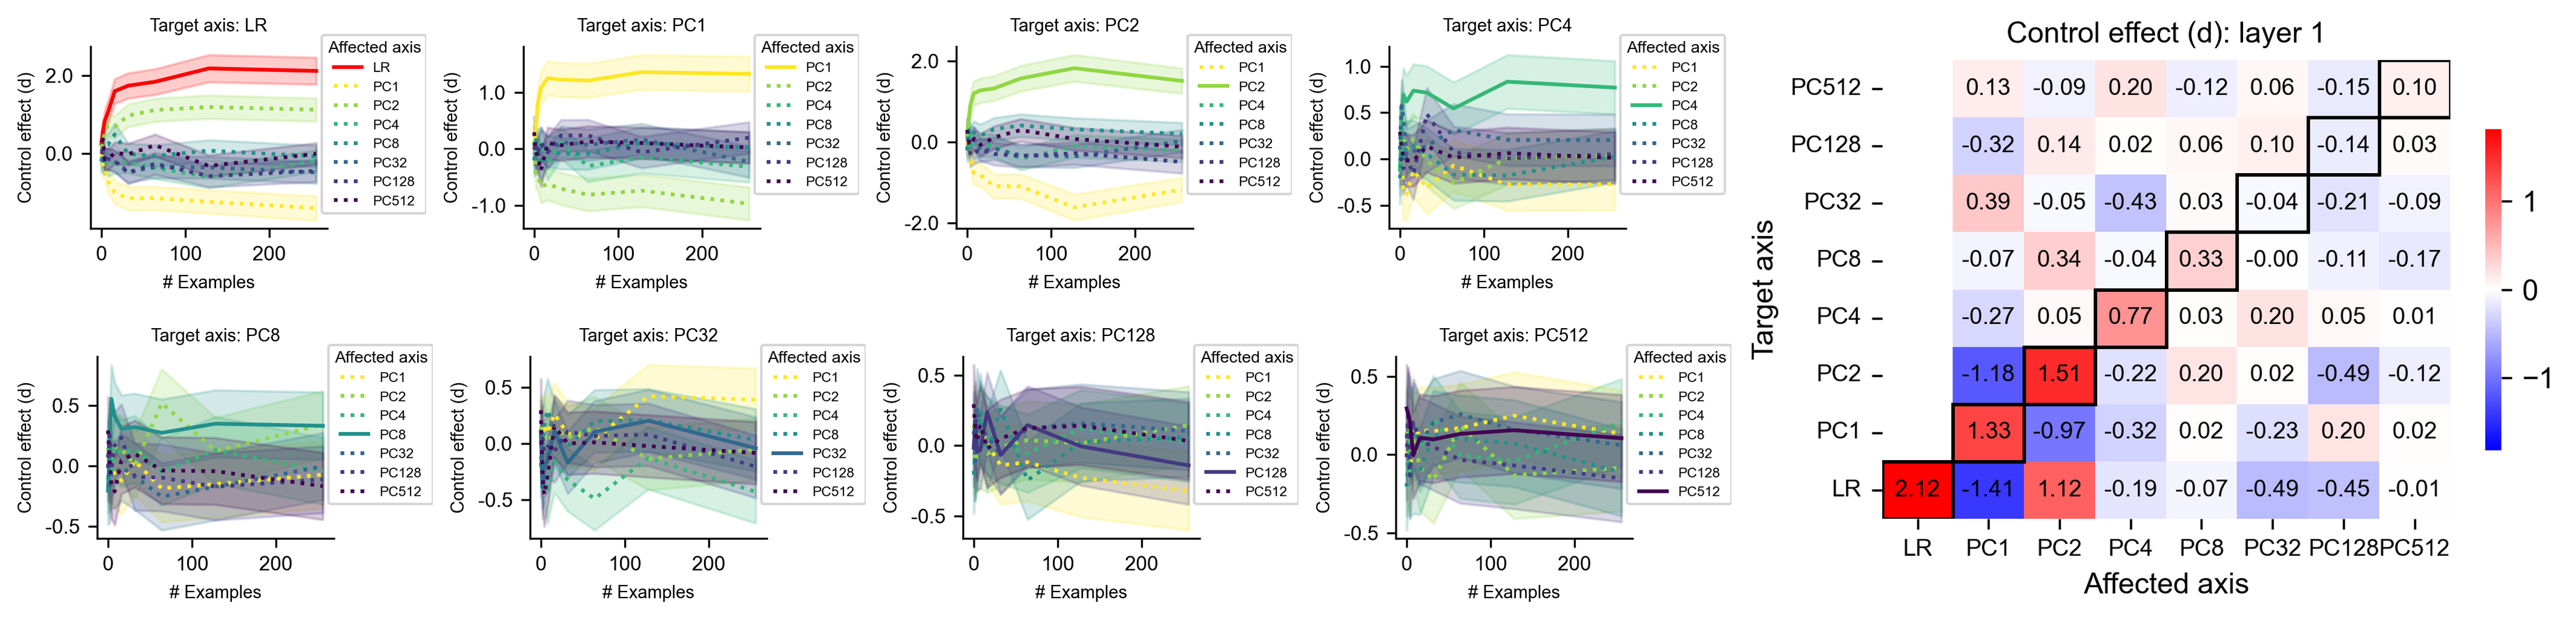
## 1. Summary Heatmap: Control effect (d): layer 1
**Location:** Right side of the image.
**Description:** A square matrix showing the final control effect value for different Target/Affected axis pairs.
**Legend:** A vertical color bar on the right ranging from -1 (Blue) to 0 (White) to 1 (Red).
### Data Table (Heatmap Values)
The Y-axis represents the **Target axis**, and the X-axis represents the **Affected axis**. Values in bold boxes indicate the diagonal (Target axis = Affected axis).
| Target \ Affected | LR | PC1 | PC2 | PC4 | PC8 | PC32 | PC128 | PC512 |
| :--- | :---: | :---: | :---: | :---: | :---: | :---: | :---: | :---: |
| **PC512** | 0.13 | -0.09 | 0.20 | -0.12 | 0.06 | -0.15 | 0.10 | **0.10** |
| **PC128** | -0.32 | 0.14 | 0.02 | 0.06 | 0.10 | -0.14 | **0.03** | - |
| **PC32** | 0.39 | -0.05 | -0.43 | 0.03 | -0.04 | **-0.21** | -0.09 | - |
| **PC8** | -0.07 | 0.34 | -0.04 | 0.33 | **-0.00** | -0.11 | -0.17 | - |
| **PC4** | -0.27 | 0.05 | 0.77 | **0.03** | 0.20 | 0.05 | 0.01 | - |
| **PC2** | -1.18 | 1.51 | **-0.22** | 0.20 | 0.02 | -0.49 | -0.12 | - |
| **PC1** | 1.33 | **-0.97** | -0.32 | 0.02 | -0.23 | 0.20 | 0.02 | - |
| **LR** | **2.12** | -1.41 | 1.12 | -0.19 | -0.07 | -0.49 | -0.45 | -0.01 |
---
## 2. Line Charts: Temporal Trends by Target Axis
Each chart shares the following axes:
* **X-axis:** # Examples (Scale: 0 to 250)
* **Y-axis:** Control effect (d)
* **Legend (Affected axis):**
* **LR:** Solid Red line
* **PC1:** Yellow dotted line
* **PC2:** Light Green solid line
* **PC4:** Green dotted line
* **PC8:** Teal solid line
* **PC32:** Blue dotted line
* **PC128:** Dark Blue solid line
* **PC512:** Purple dotted line
### Chart 1: Target axis: LR
* **Trend:** The LR (Red) line shows a sharp upward slope, stabilizing around d=2.0. PC1 (Yellow) and PC2 (Green) show significant negative and positive deviations respectively, while higher PCs cluster near zero.
* **Key Final Values:** LR ≈ 2.1, PC1 ≈ -1.4, PC2 ≈ 1.1.
### Chart 2: Target axis: PC1
* **Trend:** PC1 (Yellow) shows a sharp initial increase, stabilizing above 1.0. The LR (Red) line or other components show a mirror negative trend.
* **Key Final Values:** PC1 ≈ 1.3, LR (implied) ≈ -1.0.
### Chart 3: Target axis: PC2
* **Trend:** PC2 (Light Green) slopes upward and stabilizes near 1.5. Most other axes remain near or slightly below zero.
* **Key Final Values:** PC2 ≈ 1.5, PC1 ≈ -0.5.
### Chart 4: Target axis: PC4
* **Trend:** PC4 (Green dotted) shows a moderate upward trend, peaking and stabilizing near 0.75.
* **Key Final Values:** PC4 ≈ 0.8.
### Chart 5: Target axis: PC8
* **Trend:** High variance initially. PC8 (Teal solid) stabilizes slightly above 0. PC4 (Green dotted) shows a higher positive trend in this specific target context.
* **Key Final Values:** PC4 ≈ 0.4, PC8 ≈ 0.3.
### Chart 6: Target axis: PC32
* **Trend:** Most lines cluster around zero. PC1 (Yellow) shows a slight upward trend toward 0.4.
* **Key Final Values:** PC1 ≈ 0.4, PC32 ≈ -0.2.
### Chart 7: Target axis: PC128
* **Trend:** Significant noise/variance (shaded areas). Most values converge between -0.2 and 0.2.
* **Key Final Values:** PC1 ≈ 0.2, PC128 ≈ 0.0.
### Chart 8: Target axis: PC512
* **Trend:** Highly compressed scale. All lines stay within the -0.2 to 0.2 range.
* **Key Final Values:** PC2 ≈ 0.2, PC512 ≈ 0.1.
---
## 3. Component Observations
* **Diagonal Dominance:** In the heatmap, the highest absolute values are often found when the Target axis matches the Affected axis (e.g., LR/LR at 2.12), though PC1 and PC2 show strong cross-interference.
* **Convergence:** In all line charts, the "Control effect" typically stabilizes after approximately 100 examples.
* **Variance:** Shaded regions around lines indicate confidence intervals or variance, which appears larger for higher-order PCs (PC128, PC512).