## Line Chart: Token Span Analysis by Request ID
### Overview
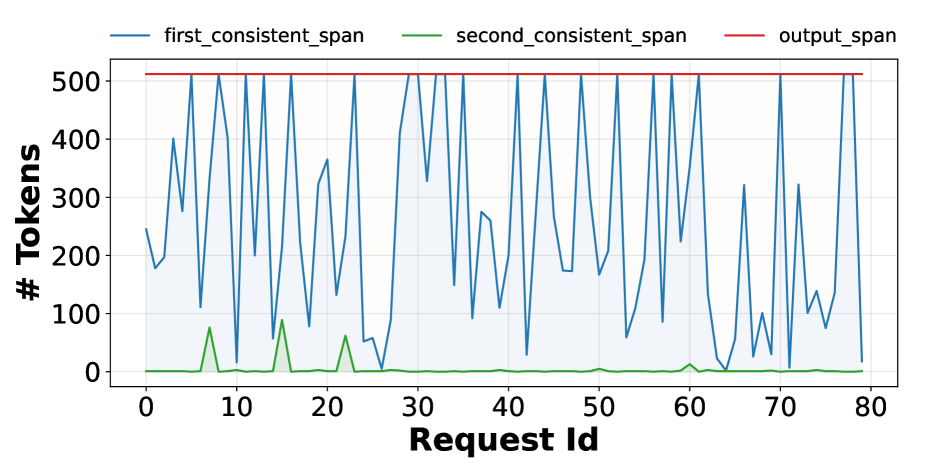
This image displays a line chart tracking three distinct metrics—`first_consistent_span`, `second_consistent_span`, and `output_span`—across 80 individual requests. The chart visualizes the token usage or span length for these metrics, with the X-axis representing the Request ID and the Y-axis representing the number of tokens.
### Components/Axes
* **X-Axis:** Labeled "Request Id". The scale ranges from 0 to 80, with major tick marks every 10 units.
* **Y-Axis:** Labeled "# Tokens". The scale ranges from 0 to 500, with grid lines at 100-unit intervals (100, 200, 300, 400, 500).
* **Legend:** Positioned at the top center of the chart.
* **Blue line:** `first_consistent_span`
* **Green line:** `second_consistent_span`
* **Red line:** `output_span`
* **Visual Elements:** The area beneath the blue line is shaded with a light blue tint; the area beneath the green line is shaded with a light green tint.
### Detailed Analysis
#### 1. Red Line (`output_span`)
* **Trend:** This line is perfectly horizontal, indicating a constant value.
* **Value:** It remains fixed at approximately 512 tokens throughout the entire duration (0 to 80 requests). This appears to represent a hard limit or a maximum configuration setting.
#### 2. Blue Line (`first_consistent_span`)
* **Trend:** This series exhibits high volatility, oscillating rapidly between near-zero values and the maximum limit (512).
* **Data Points:**
* The line frequently hits the `output_span` ceiling (512) at various intervals, notably around Request IDs 7, 11, 15, 22, 28, 32, 47, 52, 61, 73, and 79.
* It drops to near-zero values at several points, most notably around Request IDs 26, 42, 65, and 72.
* The baseline for this line is generally unstable, fluctuating between 50 and 300 tokens when not hitting the ceiling.
#### 3. Green Line (`second_consistent_span`)
* **Trend:** This series is predominantly flat at 0, with three distinct, isolated spikes occurring early in the sequence.
* **Data Points:**
* **Spike 1:** Occurs around Request ID 7-8, reaching a peak of approximately 80 tokens.
* **Spike 2:** Occurs around Request ID 14-15, reaching a peak of approximately 90 tokens.
* **Spike 3:** Occurs around Request ID 21-22, reaching a peak of approximately 60 tokens.
* **Minor Activity:** A very small, negligible blip occurs around Request ID 60, reaching approximately 15 tokens.
### Key Observations
* **Ceiling Effect:** The `output_span` (red line) acts as a hard cap for the `first_consistent_span` (blue line). The blue line frequently reaches this cap, suggesting that the system is often hitting its maximum token limit.
* **Sparse Activity:** The `second_consistent_span` (green line) is highly inactive. It only shows significant activity in the first 25% of the requests (0-25). After Request ID 25, it remains almost entirely dormant.
* **Inverse Relationship:** There is no obvious inverse correlation between the blue and green lines; rather, the green line appears to be an independent, intermittent process that ceases to trigger after the initial phase.
### Interpretation
This chart likely represents the performance monitoring of an LLM (Large Language Model) or a similar text-generation API.
* **The Red Line (512):** This is almost certainly the `max_tokens` parameter or the context window limit set for the model.
* **The Blue Line:** This represents the actual token count of the primary input or output span. The high volatility and frequent hitting of the 512-token ceiling suggest that the model is frequently being truncated or is consistently filling its allocated context window.
* **The Green Line:** This likely represents a secondary, conditional process (perhaps a specific type of tool-use, a secondary prompt, or a "warm-up" routine) that is only invoked during the early stages of the request batch. The fact that it disappears after Request ID 25 suggests that the conditions required to trigger this "second span" are no longer met in the later requests.
In summary, the system is operating at its capacity limit (`output_span`) frequently, and a secondary process (`second_consistent_span`) is only relevant during the initial phase of the operation.