## Line Chart: Training Loss Curve
### Overview
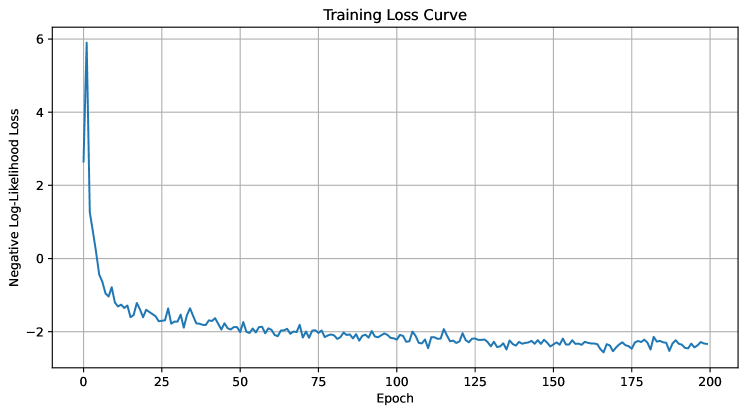
The image depicts a line chart titled "Training Loss Curve," illustrating the progression of negative log-likelihood loss over training epochs. The chart shows a sharp initial decline in loss, followed by stabilization with minor fluctuations.
### Components/Axes
- **X-axis (Horizontal)**: Labeled "Epoch," with values ranging from 0 to 200 in increments of 25.
- **Y-axis (Vertical)**: Labeled "Negative Log-Likelihood Loss," with values ranging from -2 to 6 in increments of 2.
- **Legend**: Not visible in the image.
- **Line**: A single blue line representing the loss curve, with no markers or annotations.
### Detailed Analysis
- **Initial Phase (Epochs 0–25)**: The loss starts at approximately 6 and drops sharply to around -2 by epoch 25. This steep decline suggests rapid improvement in model performance during early training.
- **Stabilization Phase (Epochs 25–200)**: After epoch 25, the loss stabilizes near -2, with minor oscillations (approximately ±0.2). The fluctuations are consistent but do not indicate significant overfitting or underfitting.
- **Final Value**: By epoch 200, the loss remains close to -2, indicating convergence of the training process.
### Key Observations
1. **Rapid Initial Decline**: The loss decreases by ~8 units (from 6 to -2) within the first 25 epochs, highlighting the model's sensitivity to early training adjustments.
2. **Stable Convergence**: The loss plateaus near -2 after epoch 25, suggesting the model has reached a stable state with minimal further improvement.
3. **No Overfitting Signs**: The absence of a rising loss trend after stabilization implies the model generalizes well without overfitting.
### Interpretation
The chart demonstrates a typical training dynamics pattern: a steep initial drop in loss as the model learns key features, followed by stabilization as it refines its parameters. The negative log-likelihood loss approaching -2 indicates a well-trained model with low uncertainty in predictions. The lack of a legend or additional data series suggests this is a single-model evaluation. The absence of overfitting (loss does not increase post-stabilization) implies effective regularization or a well-balanced dataset. The early convergence (by epoch 25) may indicate a relatively simple problem or a highly effective learning rate schedule.