## Scatter Plots: I/O Quantization and IR Drop Analysis
### Overview
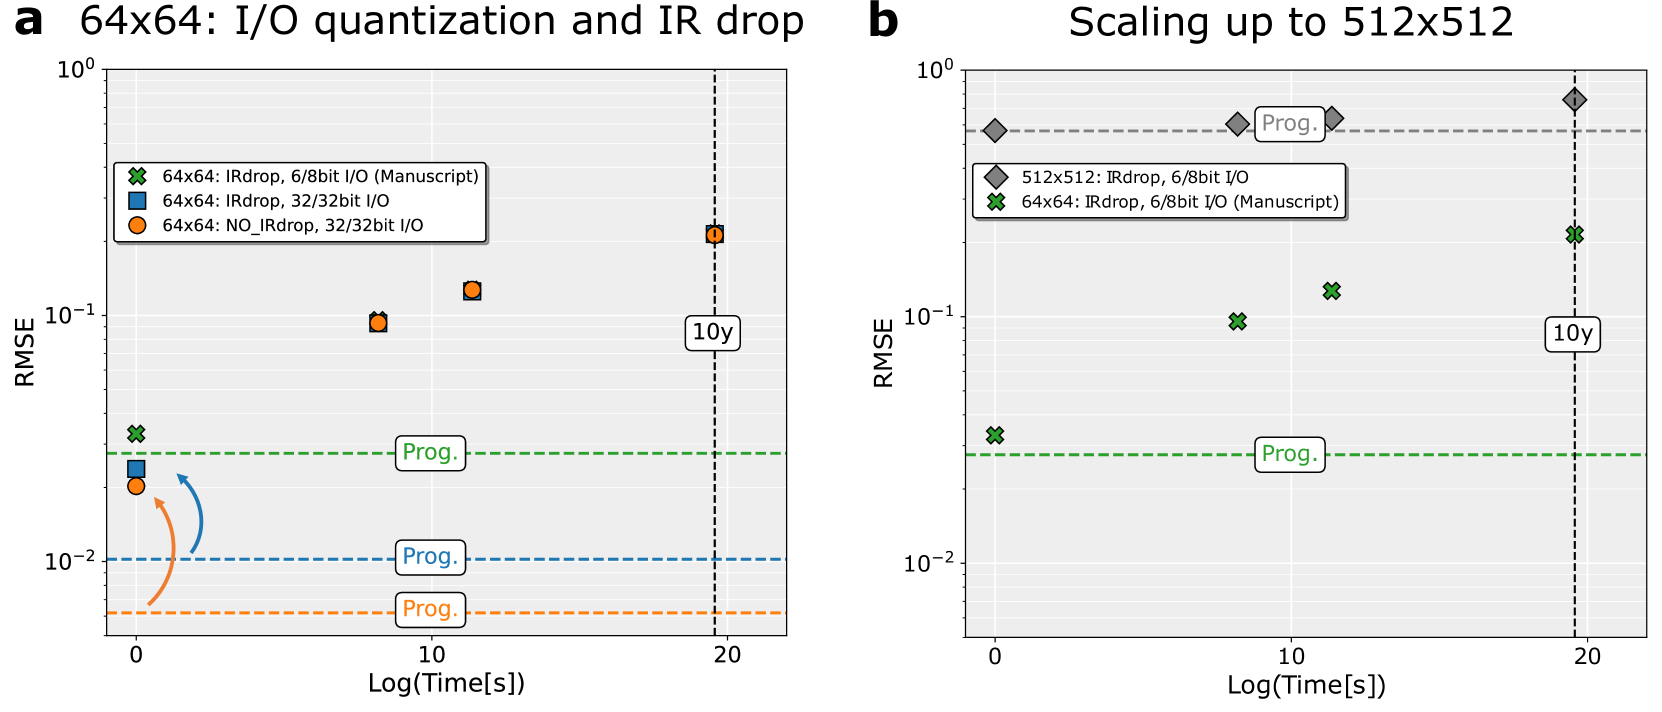
Two scatter plots compare root mean square error (RMSE) against logarithmic time (Log(Time[s])) for different I/O quantization schemes and IR drop configurations. Chart **a** focuses on 64x64 configurations, while chart **b** examines scaling to 512x512. Both plots use logarithmic axes and include progression reference lines.
---
### Components/Axes
#### Chart a: 64x64 Configurations
- **X-axis**: Log(Time[s]) (0 to 20)
- **Y-axis**: RMSE (10⁻³ to 10⁰)
- **Legend**:
- Green crosses: 64x64 IRdrop, 6/8bit I/O (Manuscript)
- Blue squares: 64x64 IRdrop, 32/32bit I/O
- Orange circles: 64x64 NO_IRdrop, 32/32bit I/O
- **Dashed Lines**:
- Green: "Prog." (RMSE ≈ 10⁻¹)
- Blue: "Prog." (RMSE ≈ 10⁻²)
- Orange: "Prog." (RMSE ≈ 10⁻³)
#### Chart b: 512x512 Scaling
- **X-axis**: Log(Time[s]) (0 to 20)
- **Y-axis**: RMSE (10⁻² to 10⁰)
- **Legend**:
- Gray diamonds: 512x512 IRdrop, 6/8bit I/O
- Green crosses: 64x64 IRdrop, 6/8bit I/O (Manuscript)
- **Dashed Line**:
- Gray: "Prog." (RMSE ≈ 10⁻¹)
---
### Detailed Analysis
#### Chart a
- **Green crosses (6/8bit I/O)**:
- RMSE values: ~10⁻¹ to 10⁻²
- Time range: 10⁻¹ to 10¹ seconds
- **Blue squares (32/32bit I/O)**:
- RMSE values: ~10⁻¹
- Time range: 10⁰ to 10¹ seconds
- **Orange circles (NO_IRdrop)**:
- RMSE values: ~10⁻¹ to 10⁰
- Time range: 10⁰ to 10¹ seconds
- **Trends**:
- Green crosses show the lowest RMSE, improving with time.
- Blue squares and orange circles plateau at higher RMSE values.
- Dashed lines indicate progression thresholds.
#### Chart b
- **Green crosses (64x64 6/8bit I/O)**:
- RMSE values: ~10⁻¹ to 10⁻²
- Time range: 10⁰ to 10¹ seconds
- **Gray diamonds (512x512 6/8bit I/O)**:
- RMSE values: ~10⁻¹ to 10⁰
- Time range: 10⁰ to 10¹ seconds
- **Trends**:
- Green crosses maintain lower RMSE than gray diamonds.
- Progression line (10⁻¹) separates high and low performance.
---
### Key Observations
1. **IRdrop Impact**: Configurations with IRdrop (green crosses) consistently outperform NO_IRdrop (orange circles) in RMSE.
2. **Bit Depth Tradeoff**: 6/8bit I/O (green) achieves lower RMSE than 32/32bit I/O (blue/orange) at similar time scales.
3. **Scaling Effects**: 512x512 IRdrop (gray diamonds) shows higher RMSE than 64x64 IRdrop (green crosses), suggesting diminishing returns at larger scales.
4. **Progression Lines**: Dashed lines act as benchmarks, with performance clustering around or below these thresholds.
---
### Interpretation
The data demonstrates that **IRdrop with lower bit I/O (6/8bit)** optimizes RMSE across both 64x64 and 512x512 scales, outperforming higher bit I/O (32/32bit) and configurations without IRdrop. The progression lines suggest that as time increases, systems with IRdrop approach or maintain performance near these benchmarks. Scaling to 512x512 introduces higher RMSE compared to 64x64, indicating potential architectural limitations at larger scales. The absence of IRdrop (orange circles) results in significantly worse performance, highlighting its critical role in error minimization. These findings align with the "Prog." thresholds, suggesting that IRdrop-enabled systems are designed to meet or exceed these targets.