## Grid Plot: Pixel Pattern
### Overview
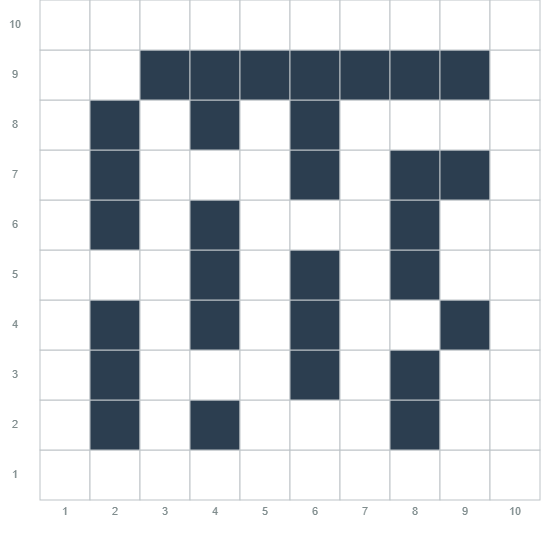
The image is a grid plot, 10x10, where some cells are filled with a dark blue color, creating a pattern. The axes are numbered from 1 to 10.
### Components/Axes
* **X-axis:** Numerical scale from 1 to 10, incrementing by 1.
* **Y-axis:** Numerical scale from 1 to 10, incrementing by 1.
* **Grid:** 10x10 grid with light gray lines.
* **Data:** Dark blue filled cells forming a pattern.
### Detailed Analysis
The grid contains a pattern of filled (dark blue) and empty (white) cells. The filled cells are located at the following coordinates:
* (2, 2), (2, 4), (2, 6), (2, 8)
* (3, 3), (3, 9)
* (4, 2), (4, 4), (4, 6)
* (5, 9)
* (6, 3), (6, 5)
* (7, 9)
* (8, 4), (8, 6)
* (9, 7), (9, 9)
### Key Observations
The pattern formed by the filled cells does not appear to have any immediate symmetry or easily discernible structure.
### Interpretation
The image represents a binary matrix or a simple pixel-based graphic. Without additional context, the meaning of the pattern is unclear. It could represent a character, a symbol, or a random distribution. The data is discrete and spatial, with each cell either "on" (filled) or "off" (empty).