\n
## Diagram: Reflection and Refraction Scenarios
### Overview
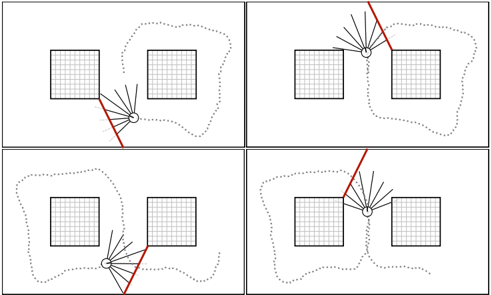
The image presents a 2x2 grid of diagrams illustrating the concepts of reflection and refraction of light. Each diagram depicts a wavefront (represented by a series of radiating lines) encountering a boundary between two media, resulting in either reflection or refraction (or both). The diagrams are schematic and do not contain numerical data.
### Components/Axes
Each diagram contains the following components:
* **Wavefront:** A series of lines radiating outwards from a central point, representing a wave.
* **Boundary:** A red line representing the interface between two media.
* **Media:** Two distinct regions, one with a grid pattern and one with a dotted pattern, representing different optical properties.
* **Incident Point:** A white circle marking the point where the wavefront first encounters the boundary.
There are no explicit axes or legends.
### Detailed Analysis or Content Details
The diagrams can be described as follows:
* **Top-Left:** The wavefront approaches the boundary at an angle. A portion of the wavefront is reflected back into the grid medium, while the remaining portion is refracted into the dotted medium, bending *away* from the normal (an imaginary line perpendicular to the boundary).
* **Top-Right:** The wavefront approaches the boundary at a steeper angle. A larger portion of the wavefront is reflected back into the grid medium, and the refracted portion bends further away from the normal.
* **Bottom-Left:** The wavefront approaches the boundary at a shallow angle. A smaller portion of the wavefront is reflected, and the refracted portion bends slightly away from the normal.
* **Bottom-Right:** The wavefront approaches the boundary at an angle similar to the top-right diagram, but the refracted ray bends more sharply.
The angle of incidence (angle between the wavefront and the normal) varies in each diagram. The angle of reflection is approximately equal to the angle of incidence in each case. The angle of refraction is different from the angle of incidence, indicating a change in the speed of light as it enters the new medium.
### Key Observations
* The diagrams demonstrate the law of reflection (angle of incidence equals angle of reflection).
* The diagrams demonstrate the principle of refraction, where light bends when passing from one medium to another.
* The amount of reflection increases as the angle of incidence increases.
* The amount of bending (refraction) varies depending on the angle of incidence.
### Interpretation
These diagrams illustrate fundamental principles of optics. They demonstrate how light behaves when it encounters a boundary between two different media. The diagrams show that light can be both reflected and refracted, and that the amount of each depends on the angle at which the light strikes the boundary. The grid and dotted patterns represent media with different refractive indices, causing the bending of light during refraction. The diagrams are conceptual and do not provide quantitative data, but they effectively convey the qualitative behavior of light in these scenarios. The diagrams are useful for understanding how lenses and other optical devices work.