## Diagram: Robot Pathfinding Simulation in Grid Environment
### Overview
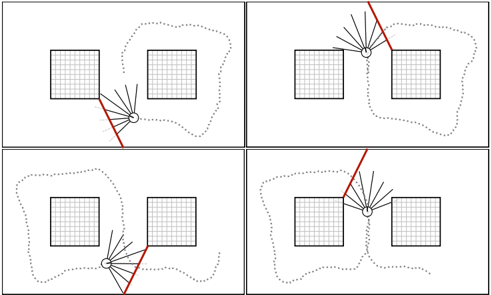
The image depicts a four-panel sequence illustrating a robot's movement and pathfinding in a grid-based environment. Each panel shows a 2x2 grid with two shaded squares (obstacles) and a dotted path representing the robot's trajectory. Red lines indicate directional movement or sensor rays.
### Components/Axes
- **Grid Layout**:
- 2x2 grid in each panel, divided into four equal squares.
- Two squares are shaded (black grid patterns), representing obstacles.
- Dotted paths (gray) show the robot's movement history.
- Red lines represent instantaneous movement or sensor activation.
- **Robot**:
- Circular shape with radiating lines (sensors) in some panels.
- Positioned at grid intersections or mid-grid points.
- **Pathfinding Elements**:
- Dotted paths vary in complexity across panels, suggesting iterative path adjustments.
- Red lines originate from the robot, indicating directional decisions.
### Detailed Analysis
- **Panel 1 (Top-Left)**:
- Robot starts at the bottom-left grid intersection.
- Dotted path curves upward, avoiding the top-left obstacle.
- Red line extends diagonally toward the top-right obstacle.
- **Panel 2 (Top-Right)**:
- Robot moves to the top-right grid intersection.
- Dotted path loops around the top-left obstacle.
- Red line extends horizontally leftward.
- **Panel 3 (Bottom-Left)**:
- Robot positioned at the bottom-right grid intersection.
- Dotted path loops around the bottom-left obstacle.
- Red line extends diagonally upward-left.
- **Panel 4 (Bottom-Right)**:
- Robot at the center of the grid.
- Dotted path forms a complex loop around both obstacles.
- Red line extends horizontally rightward.
### Key Observations
1. **Pathfinding Strategy**:
- The robot avoids obstacles by adjusting its trajectory, as shown by the dotted paths.
- Red lines suggest real-time sensor feedback influencing movement decisions.
2. **Grid Symmetry**:
- Obstacles are consistently placed in the top-left and bottom-right squares across all panels.
3. **Sensor Coverage**:
- Radiating lines (sensors) in Panels 2 and 4 indicate omnidirectional awareness.
### Interpretation
The diagram demonstrates a reactive pathfinding algorithm where the robot dynamically adjusts its route based on obstacle detection. The red lines likely represent sensor-triggered movements, while the dotted paths visualize historical trajectories. The consistent obstacle placement suggests a controlled environment for testing navigation strategies. No numerical data or textual labels are present, so quantitative analysis is not applicable.