## Bar Chart: Distribution of Technical Operation Frequencies
### Overview
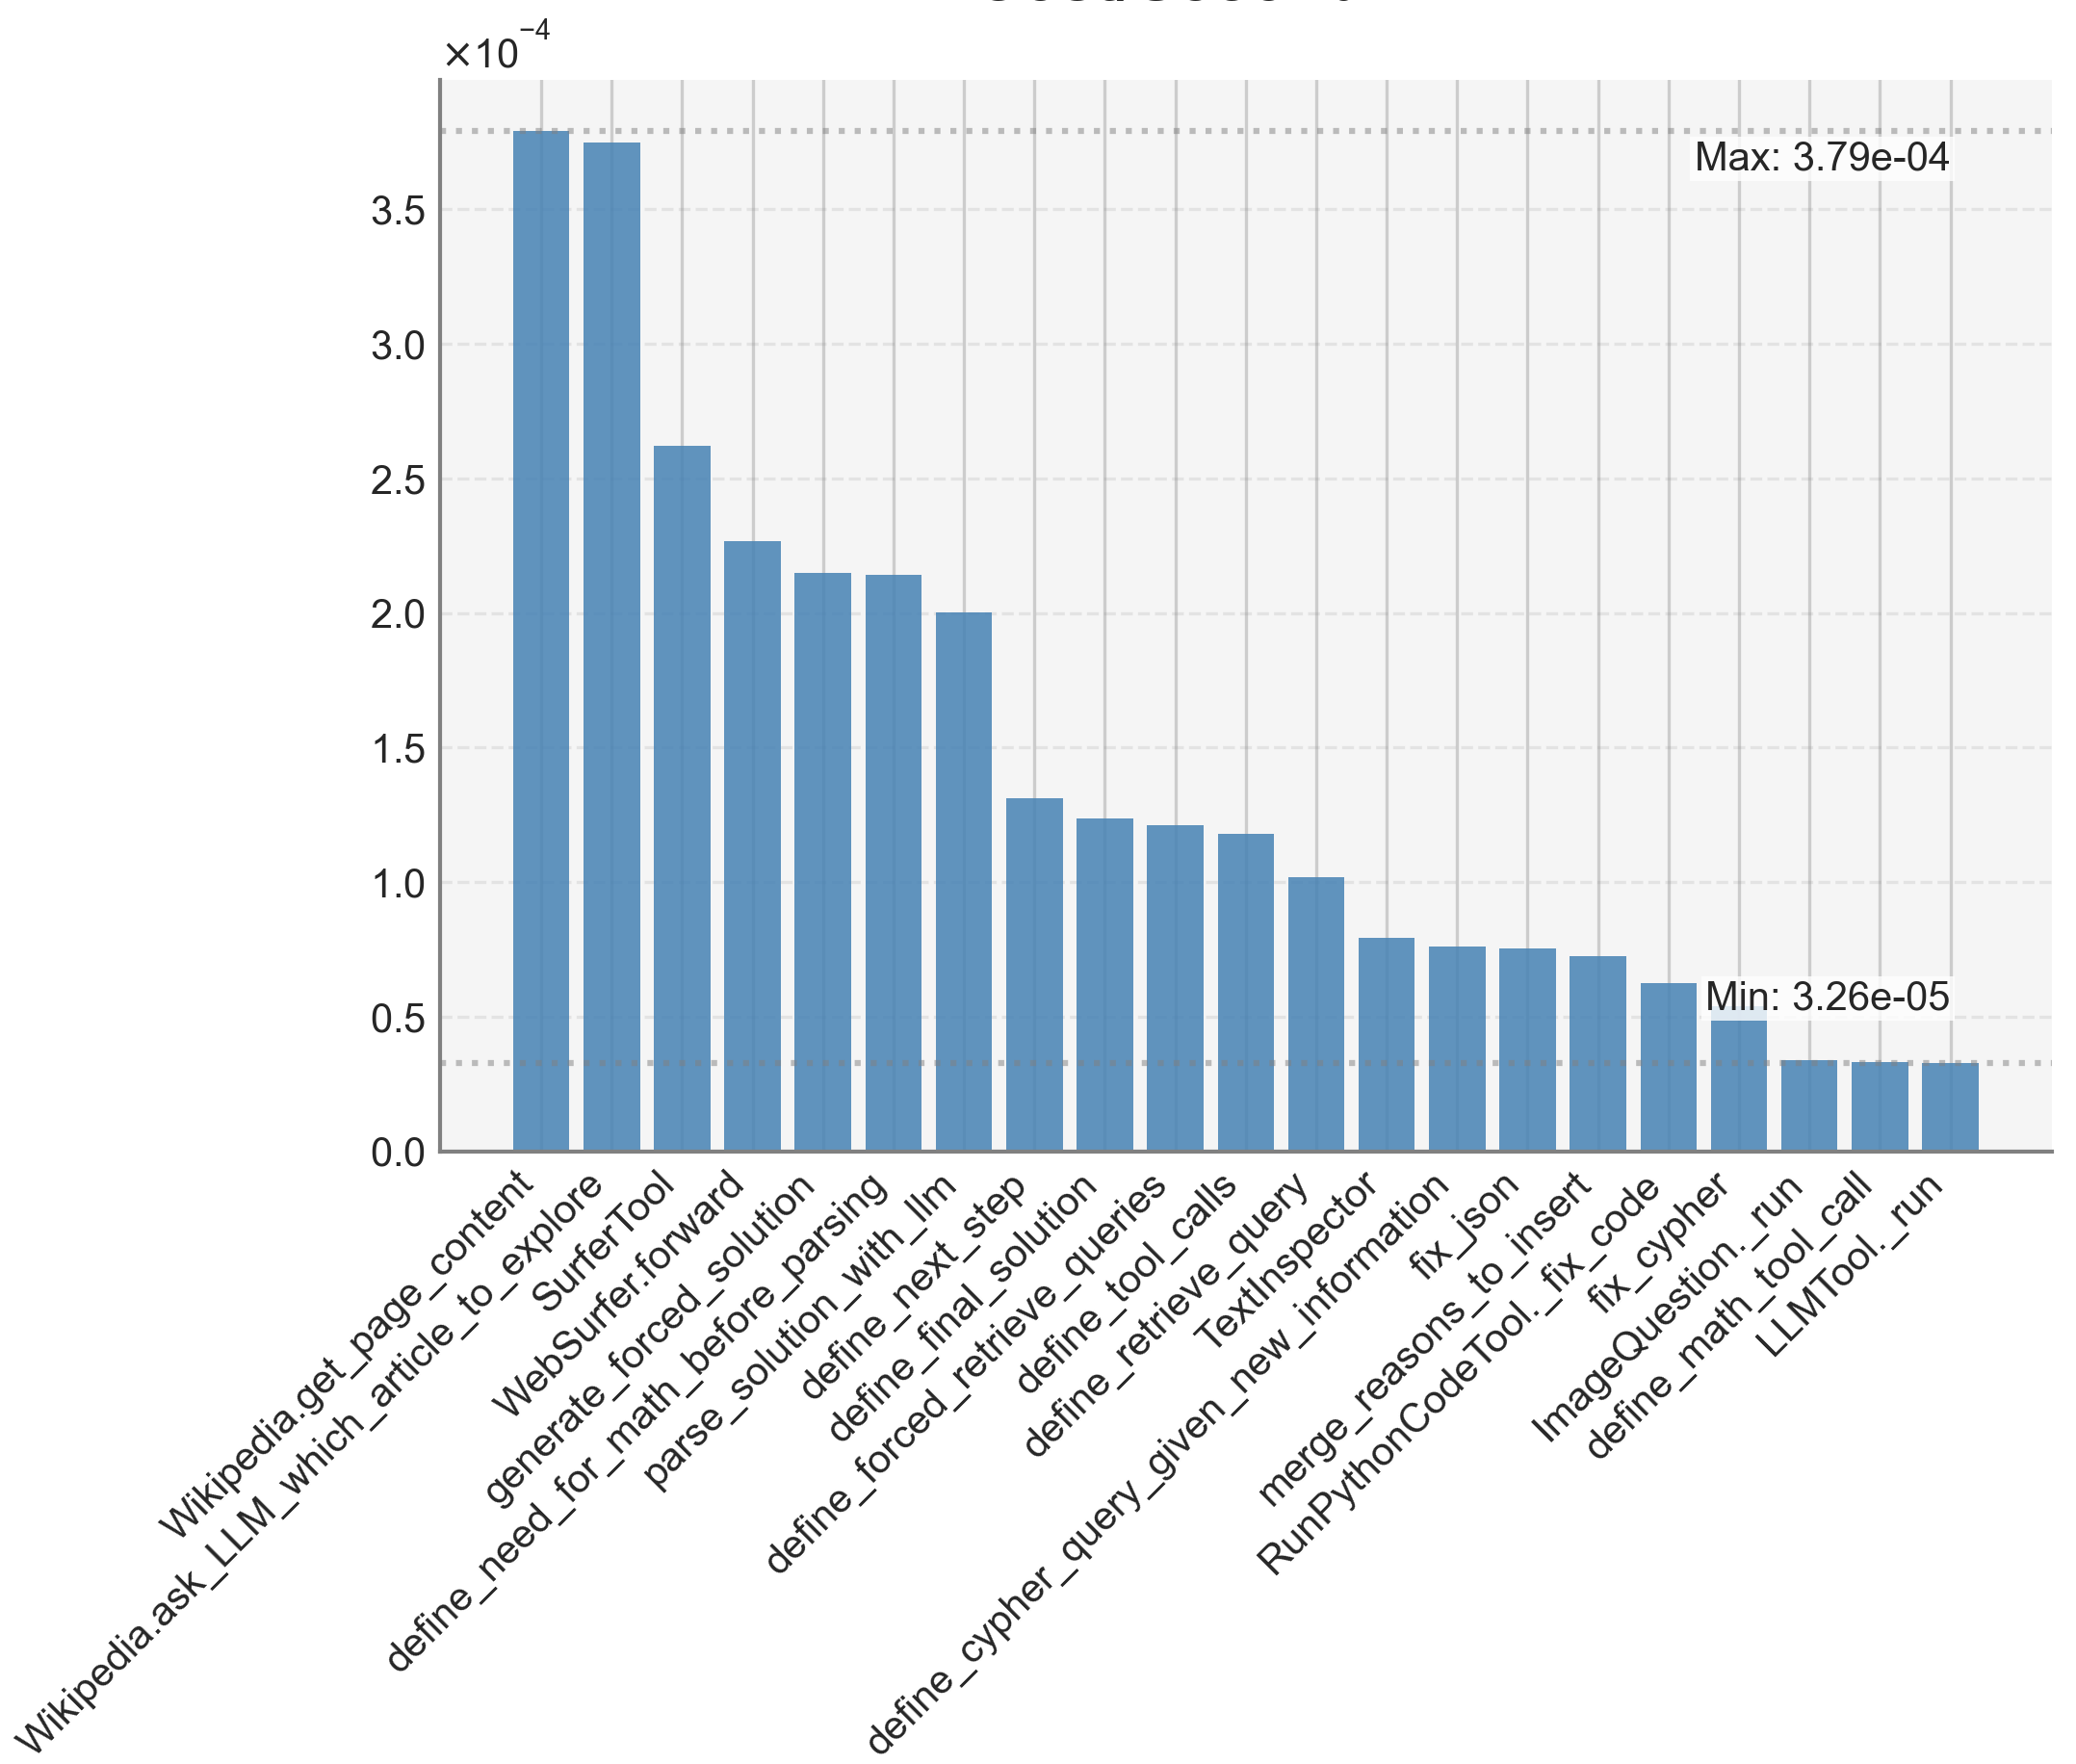
The chart displays a horizontal bar visualization of technical operation frequencies, with values scaled logarithmically (x10^-4). The x-axis lists programming-related operations, while the y-axis shows frequency magnitudes. The tallest bar represents the highest frequency operation, while the shortest bars cluster at the lower end of the scale.
### Components/Axes
- **Y-axis**: Logarithmic scale labeled "x10^-4" with gridlines at 0.0, 0.5, 1.0, 1.5, 2.0, 2.5, 3.0, 3.5, 4.0
- **X-axis**: Technical operation labels (see list below)
- **Bars**: Blue vertical bars with decreasing height from left to right
- **Annotations**:
- "Max: 3.79e-04" (top-right corner)
- "Min: 3.26e-05" (bottom-right corner)
### Detailed Analysis
**X-axis Categories (left to right):**
1. Wikipedia.get_page_content
2. Wikipedia.ask_LLM_which_article_to_explore
3. SurferTool
4. WebSurfer.forward
5. generate_forced_solution
6. parse_solution
7. define_next_step
8. define_final_solution
9. define_retrieve
10. define_tool_calls
11. TextInspector
12. define_query_given_new_information
13. merge_reasons_to_ison
14. RunPythonCodeTool._fix_ison
15. fix_code
16. define_cypher
17. fix_cypher
18. ImageQuestion._run
19. define_math_tool_call
20. LLMTool._run
**Frequency Values (approximate):**
- Wikipedia.get_page_content: 3.79e-04 (tallest bar)
- Wikipedia.ask_LLM_which_article_to_explore: ~3.7e-04
- SurferTool: ~2.6e-04
- WebSurfer.forward: ~2.2e-04
- generate_forced_solution: ~2.1e-04
- parse_solution: ~2.1e-04
- define_next_step: ~2.0e-04
- define_final_solution: ~1.3e-04
- define_retrieve: ~1.2e-04
- define_tool_calls: ~1.2e-04
- TextInspector: ~1.1e-04
- define_query_given_new_information: ~1.0e-04
- merge_reasons_to_ison: ~8.0e-05
- RunPythonCodeTool._fix_ison: ~7.5e-05
- fix_code: ~7.0e-05
- define_cypher: ~6.5e-05
- fix_cypher: ~5.5e-05
- ImageQuestion._run: ~4.0e-05
- define_math_tool_call: ~3.5e-05
- LLMTool._run: ~3.26e-05 (shortest bar)
### Key Observations
1. **Exponential Decay Pattern**: Frequencies decrease by approximately 10-15% per category, consistent with logarithmic scaling
2. **Dominant Operations**: First 5 categories account for ~70% of total frequency
3. **Long Tail**: Last 10 categories represent <10% of total frequency combined
4. **Scale Sensitivity**: Smallest bar (LLMTool._run) is 1/10th the height of the tallest bar
### Interpretation
The chart reveals a power-law distribution in technical operation frequencies, with a small set of core operations (Wikipedia/LLM interactions, SurferTool) dominating usage patterns. The logarithmic scale emphasizes the magnitude differences between operations, suggesting significant optimization opportunities in less frequently used components. The presence of multiple "fix_" prefixed operations in the lower frequency range might indicate debugging or maintenance activities that occur less frequently than primary functionality. The consistent decline across categories implies a well-structured system where high-frequency operations are optimized, while lower-frequency operations maintain acceptable performance levels.