## Line Chart: Posterior Density Distribution for Binary Outcome (B(3,3))
### Overview
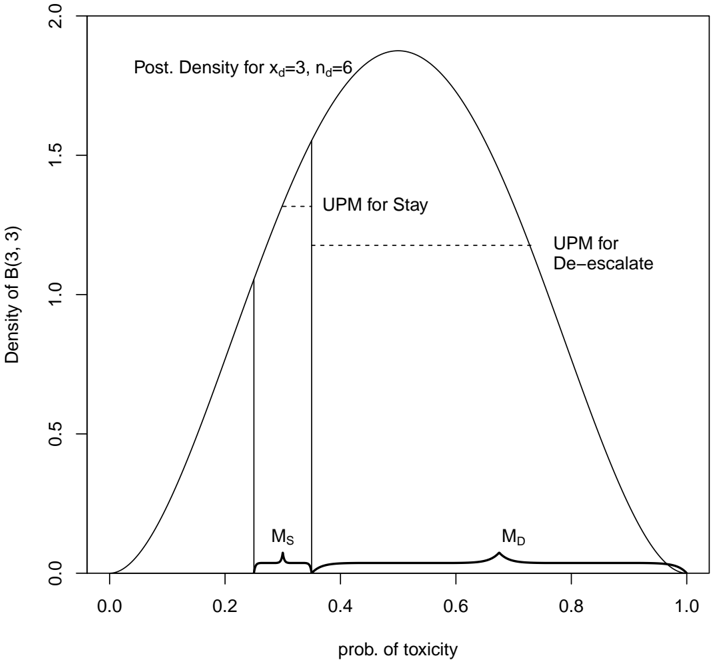
The chart illustrates the posterior density distribution of a binary outcome (B(3,3)) with parameters `x_d=3` (successes) and `n_d=6` (trials). The x-axis represents the "prob. of toxicity" (probability of a binary event), while the y-axis shows the "Density of B(3,3)" (probability density). Key elements include a main density curve, two horizontal dashed lines labeled "UPM for Stay" and "UPM for De-escalate," and two markers (`M_S` and `M_D`) on the x-axis.
### Components/Axes
- **X-axis**: "prob. of toxicity" (ranges from 0.0 to 1.0).
- **Y-axis**: "Density of B(3,3)" (ranges from 0.0 to 2.0).
- **Legend**: Located in the top-left corner, with labels:
- Solid line: "Post. Density for x_d=3, n_d=6" (main curve).
- Dashed line: "UPM for Stay" (horizontal line at ~0.35 density).
- Dashed line: "UPM for De-escalate" (horizontal line at ~0.65 density).
- **Markers**:
- `M_S`: Vertical line at ~0.3 on the x-axis (left of the peak).
- `M_D`: Vertical line at ~0.7 on the x-axis (right of the peak).
### Detailed Analysis
- **Main Curve**:
- Peaks at ~0.4 on the x-axis (prob. of toxicity).
- Density reaches ~1.8 at the peak.
- Symmetrical distribution around the peak, tapering to ~0.0 at x=0.0 and x=1.0.
- **UPM Lines**:
- "UPM for Stay": Horizontal dashed line at ~0.35 density (intersects the main curve at ~0.3 and ~0.5 on the x-axis).
- "UPM for De-escalate": Horizontal dashed line at ~0.65 density (intersects the main curve at ~0.6 and ~0.8 on the x-axis).
- **Markers**:
- `M_S` (0.3): Likely represents a threshold for "Stay" decisions.
- `M_D` (0.7): Likely represents a threshold for "De-escalate" decisions.
### Key Observations
1. The posterior density is bimodal in terms of decision thresholds, with `M_S` and `M_D` marking critical points for action.
2. The "UPM for Stay" and "UPM for De-escalate" lines suggest decision boundaries based on density thresholds rather than probability values.
3. The peak at ~0.4 indicates the most probable toxicity level under the given parameters.
### Interpretation
This chart models the uncertainty in a binary outcome (e.g., toxicity) using a Beta distribution (B(3,3)), which is common in Bayesian analysis for binary data. The parameters `x_d=3` and `n_d=6` imply 3 successes (e.g., non-toxic outcomes) out of 6 trials.
- **Decision Logic**:
- The "UPM for Stay" (~0.35 density) and "UPM for De-escalate" (~0.65 density) likely represent action thresholds. For example, if the prob. of toxicity exceeds `M_D` (0.7), de-escalation is triggered. If it falls below `M_S` (0.3), the system remains in a "Stay" state.
- The horizontal UPM lines suggest that decisions are based on density rather than direct probability, which may account for uncertainty in the posterior distribution.
- **Notable Patterns**:
- The symmetry of the curve around 0.4 suggests a balanced prior (e.g., equal prior probabilities for toxicity and non-toxicity).
- The markers `M_S` and `M_D` are positioned at the tails of the distribution, indicating conservative decision thresholds to avoid false positives/negatives.
- **Anomalies**:
- The UPM lines intersect the main curve at two points each, implying that the density crosses the threshold twice. This could indicate multimodal behavior or sensitivity to parameter changes.
This analysis highlights how Bayesian posterior distributions can inform decision-making in uncertain scenarios, balancing probabilistic outcomes with actionable thresholds.