\n
## Data Table: Correlation Matrix
### Overview
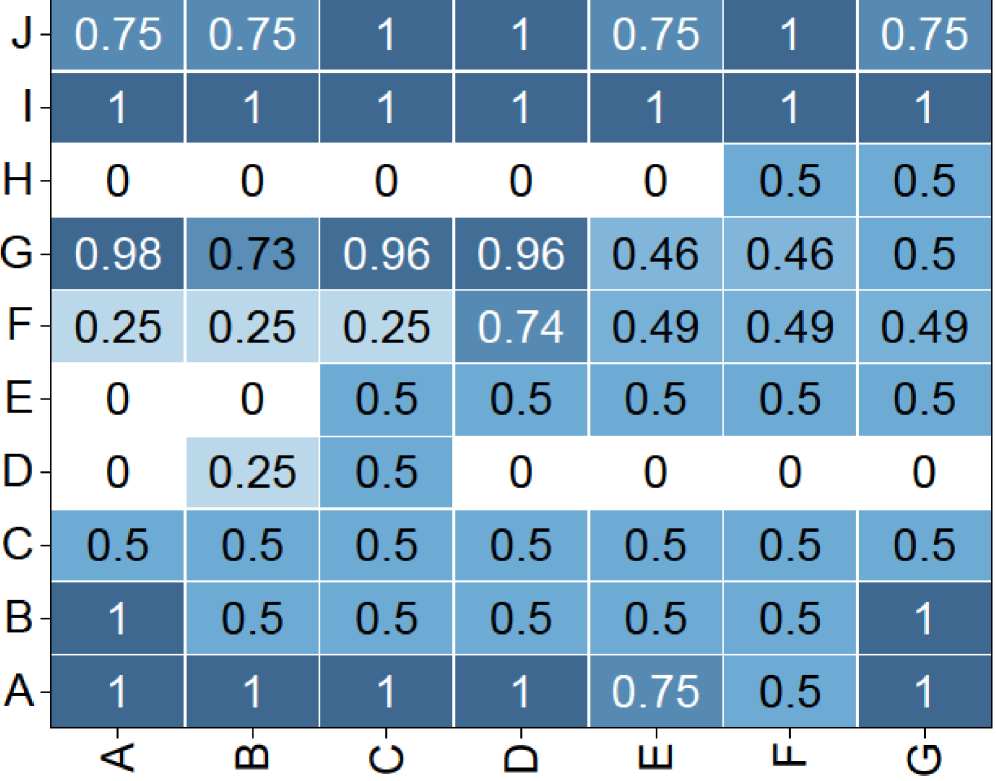
The image presents a data table representing a correlation matrix. The table displays the correlation coefficients between seven variables labeled A through G, and seven variables labeled A through G. The values range from 0 to 1, indicating the strength and direction of the linear relationship between each pair of variables.
### Components/Axes
* **Rows:** Represented by variables A, B, C, D, E, F, G.
* **Columns:** Represented by variables A, B, C, D, E, F, G.
* **Cells:** Contain the correlation coefficients between the corresponding row and column variables.
* **Values:** Numerical values ranging from 0 to 1, representing correlation coefficients.
### Detailed Analysis or Content Details
The table can be reconstructed as follows:
| | A | B | C | D | E | F | G |
| :---- | :---- | :---- | :---- | :---- | :---- | :---- | :---- |
| **A** | 1 | 1 | 1 | 1 | 0.75 | 0.5 | 1 |
| **B** | 1 | 0.5 | 0.5 | 0.5 | 0.5 | 0.5 | 1 |
| **C** | 1 | 0.5 | 0.5 | 0.5 | 0.5 | 0.5 | 0.5 |
| **D** | 1 | 0.25 | 0.5 | 0 | 0 | 0 | 0 |
| **E** | 0 | 0 | 0.5 | 0.5 | 0.5 | 0.5 | 0.5 |
| **F** | 0.25 | 0.25 | 0.25 | 0.74 | 0.49 | 0.49 | 0.49 |
| **G** | 0.98 | 0.73 | 0.96 | 0.96 | 0.46 | 0.46 | 0.5 |
**Specific Observations:**
* **Row A:** Shows strong positive correlations with variables A, B, C, D, and G (values of 1 or close to 1). Moderate correlation with E (0.75) and a weaker correlation with F (0.5).
* **Row B:** Shows a strong correlation with A and G (value of 1). Moderate correlation with C, D, E, and F (value of 0.5).
* **Row C:** Shows a strong correlation with A, B, and C (value of 1). Moderate correlation with D, E, F, and G (value of 0.5).
* **Row D:** Shows a strong correlation with A and C (value of 1). Moderate correlation with B (value of 0.25). No correlation with E, F, and G (value of 0).
* **Row E:** Shows no correlation with A, B, and D (value of 0). Moderate correlation with C, F, and G (value of 0.5).
* **Row F:** Shows weak correlations across all variables, ranging from 0.25 to 0.74.
* **Row G:** Shows strong positive correlations with A, C, and D (values close to 1). Moderate correlation with B (0.73) and weaker correlations with E and F (0.46).
### Key Observations
* Variables A, B, and C exhibit very high correlations with each other, suggesting they are likely measuring similar underlying phenomena.
* Variable D appears to be strongly related to A and C, but largely independent of E, F, and G.
* Variable F shows the weakest and most inconsistent correlations, suggesting it may be less related to the other variables.
* Variable G is strongly correlated with A, C, and D, but has a moderate correlation with B and weaker correlations with E and F.
### Interpretation
This correlation matrix suggests a complex interplay between the seven variables. The strong correlations between A, B, and C indicate a shared underlying factor or process. The relatively independent behavior of D and F suggests they represent distinct aspects of the system being studied. The moderate correlations involving G suggest it is influenced by multiple factors.
The matrix provides a quantitative measure of the linear relationships between the variables, which can be used to inform further analysis, such as dimensionality reduction or regression modeling. The presence of both strong and weak correlations highlights the need for a nuanced understanding of the relationships between these variables. The matrix does not imply causation, only association. Further investigation would be needed to determine the underlying mechanisms driving these correlations.