## Charts: Model Performance Comparison
### Overview
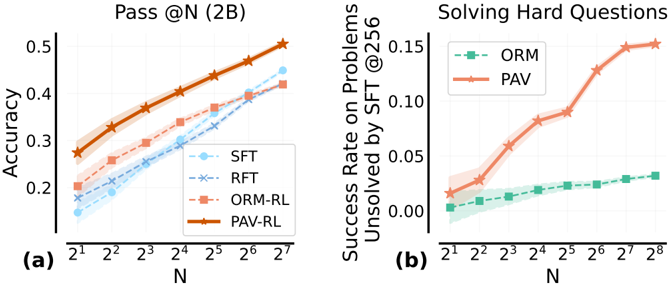
The image presents two line charts comparing the performance of different models (SFT, RFT, ORM-RL, PAV-RL, ORM, PAV) across varying values of 'N'. The left chart (a) displays "Pass @N (2B)" which appears to be an accuracy metric, while the right chart (b) shows "Success Rate on Problems Unsolved by SFT @256". Both charts use a logarithmic scale for the x-axis (N).
### Components/Axes
**Chart (a): Pass @N (2B)**
* **X-axis:** N, ranging from 2<sup>1</sup> to 2<sup>7</sup> (approximately 2 to 128).
* **Y-axis:** Accuracy, ranging from 0.15 to 0.5.
* **Data Series:**
* SFT (Light Blue)
* RFT (Pale Blue)
* ORM-RL (Light Orange)
* PAV-RL (Dark Orange)
* **Legend:** Located in the top-left corner.
**Chart (b): Solving Hard Questions**
* **X-axis:** N, ranging from 2<sup>1</sup> to 2<sup>8</sup> (approximately 2 to 256).
* **Y-axis:** Success Rate on Problems Unsolved by SFT @256, ranging from 0 to 0.15.
* **Data Series:**
* ORM (Light Green)
* PAV (Dark Orange)
* **Legend:** Located in the top-left corner.
### Detailed Analysis or Content Details
**Chart (a): Pass @N (2B)**
* **SFT (Light Blue):** The line slopes upward, starting at approximately 0.17 at N=2<sup>1</sup> and reaching approximately 0.35 at N=2<sup>7</sup>.
* **RFT (Pale Blue):** The line also slopes upward, starting at approximately 0.18 at N=2<sup>1</sup> and reaching approximately 0.42 at N=2<sup>7</sup>.
* **ORM-RL (Light Orange):** The line slopes upward more steeply than SFT and RFT, starting at approximately 0.22 at N=2<sup>1</sup> and reaching approximately 0.45 at N=2<sup>7</sup>.
* **PAV-RL (Dark Orange):** The line has the steepest upward slope, starting at approximately 0.25 at N=2<sup>1</sup> and reaching approximately 0.5 at N=2<sup>7</sup>.
**Chart (b): Solving Hard Questions**
* **ORM (Light Green):** The line is relatively flat, starting at approximately 0.02 at N=2<sup>1</sup> and reaching approximately 0.03 at N=2<sup>8</sup>.
* **PAV (Dark Orange):** The line slopes upward, starting at approximately 0.02 at N=2<sup>1</sup> and reaching approximately 0.15 at N=2<sup>8</sup>. The increase is more pronounced from N=2<sup>5</sup> onwards.
### Key Observations
* In Chart (a), PAV-RL consistently outperforms all other models across all values of N. ORM-RL performs better than RFT and SFT.
* In Chart (b), PAV demonstrates a significant increase in success rate as N increases, while ORM remains relatively stable.
* The shaded areas around the lines in both charts represent confidence intervals or standard deviations, indicating the variability in the results.
### Interpretation
The data suggests that models utilizing Reinforcement Learning (RL) – specifically ORM-RL and PAV-RL – demonstrate superior performance in the "Pass @N (2B)" task (Chart a) compared to models trained with Supervised Fine-Tuning (SFT) and Reinforcement Learning from Human Feedback (RFT). PAV-RL consistently achieves the highest accuracy.
Chart (b) highlights the ability of the PAV model to solve problems that are initially unsolved by the SFT model, and this ability increases with larger values of N. This suggests that PAV benefits from increased computational resources or a larger search space. The relatively flat performance of ORM indicates it does not scale as effectively as PAV in solving these "hard" problems.
The logarithmic scale of the x-axis (N) is crucial. It indicates that the performance gains are more significant at lower values of N, and the rate of improvement diminishes as N increases. This could be due to diminishing returns or the inherent difficulty of the task. The confidence intervals suggest that the observed differences in performance are statistically significant, but there is still some degree of uncertainty. The two charts together suggest a trade-off between overall accuracy (Chart a) and the ability to solve particularly challenging problems (Chart b).