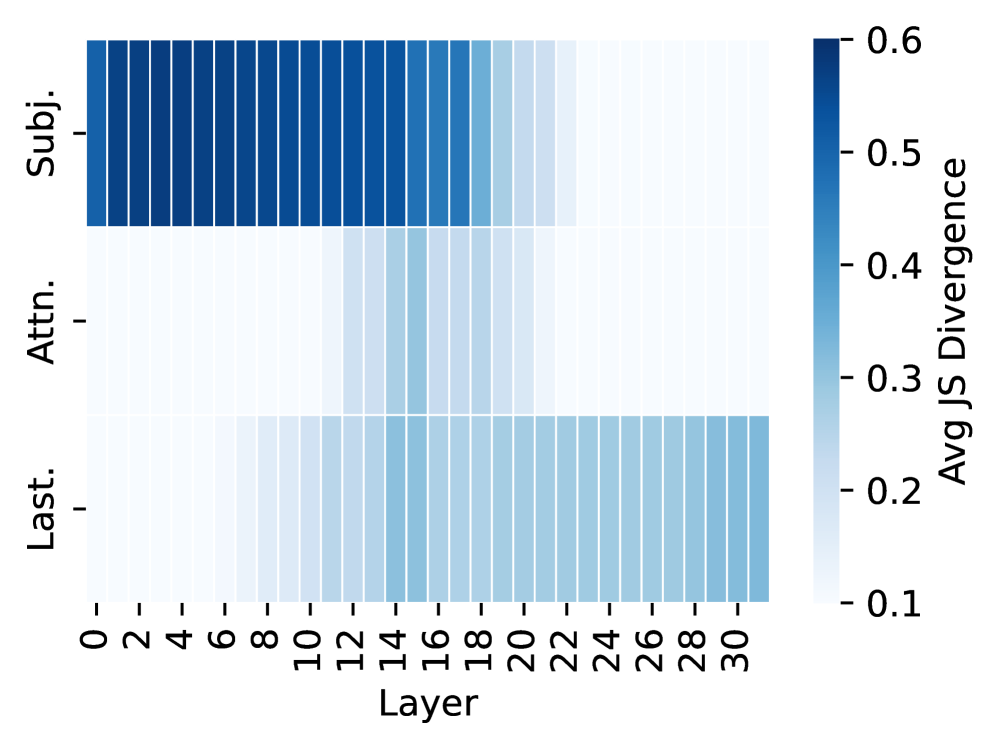
## Heatmap: Avg JS Divergence by Layer and Category
### Overview
The image is a heatmap visualizing the average Jensen-Shannon (JS) divergence across different layers (0-30) for three categories: "Subj.", "Attn.", and "Last.". The color intensity represents the magnitude of the JS divergence, ranging from approximately 0.1 (lightest blue) to 0.6 (darkest blue).
### Components/Axes
* **Y-axis:** Categories: "Subj.", "Attn.", "Last."
* **X-axis:** Layer number, ranging from 0 to 30 in increments of 2.
* **Colorbar (Right):** Represents the "Avg JS Divergence", ranging from 0.1 to 0.6. The color gradient goes from light blue (0.1) to dark blue (0.6).
### Detailed Analysis
* **Subj. (Subject):**
* From layer 0 to approximately layer 18, the JS divergence is high, indicated by the dark blue color, close to 0.6.
* From layer 20 to 30, the JS divergence decreases significantly, indicated by the lighter blue color, around 0.3.
* **Attn. (Attention):**
* The JS divergence is generally lower than "Subj." across all layers.
* From layer 0 to approximately layer 14, the JS divergence is low, around 0.2.
* From layer 16 to 30, the JS divergence increases slightly, reaching approximately 0.3.
* **Last.:**
* The JS divergence is relatively consistent across all layers, with values ranging from approximately 0.2 to 0.3.
### Key Observations
* "Subj." has the highest JS divergence in the initial layers (0-18), indicating a greater difference in distributions compared to "Attn." and "Last.".
* The JS divergence for "Subj." decreases significantly after layer 18.
* "Attn." has the lowest JS divergence in the initial layers.
* "Last." exhibits a relatively stable JS divergence across all layers.
### Interpretation
The heatmap illustrates how the Jensen-Shannon divergence varies across different layers of a model for three categories: "Subj.", "Attn.", and "Last.". The high JS divergence for "Subj." in the initial layers suggests that the distributions being compared are more dissimilar in these layers compared to the later layers. The lower and more consistent JS divergence for "Attn." and "Last." indicates a more stable and similar distribution across all layers. The data suggests that the "Subj." category undergoes a significant change in its distribution around layer 18, while "Attn." and "Last." remain relatively stable. This could indicate that the model processes or transforms the "Subj." information differently in the later layers.