## Bar Chart: BitOps: Time vs Core count
### Overview
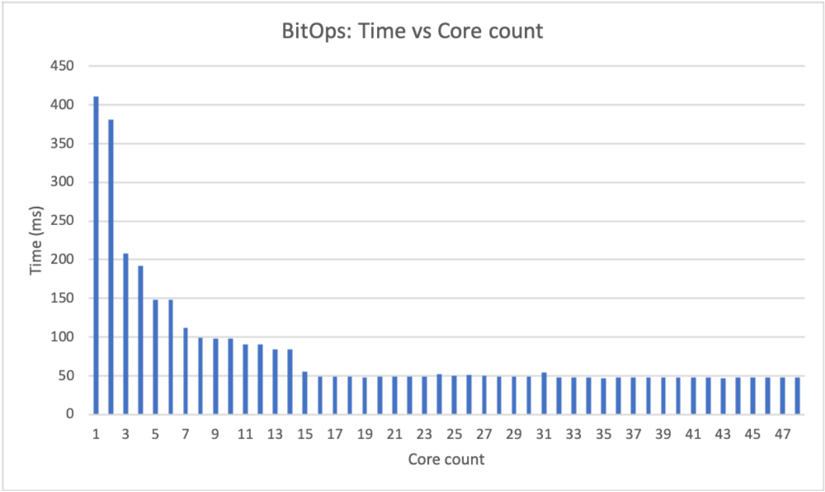
The image is a bar chart titled "BitOps: Time vs Core count". The chart displays the relationship between the number of cores (x-axis) and the time in milliseconds (y-axis). The data shows a decreasing trend in time as the core count increases, particularly at lower core counts, with the time stabilizing around 50ms for higher core counts.
### Components/Axes
* **Title:** BitOps: Time vs Core count
* **X-axis:** Core count, with integer values from 1 to 47, incrementing by 2.
* **Y-axis:** Time (ms), with values ranging from 0 to 450, incrementing by 50.
* **Data Series:** Single data series represented by blue bars.
### Detailed Analysis
The chart presents a single data series, represented by blue bars, showing the time (in milliseconds) for different core counts.
Here are approximate values for some core counts:
* **Core count 1:** Approximately 400 ms
* **Core count 3:** Approximately 210 ms
* **Core count 5:** Approximately 150 ms
* **Core count 7:** Approximately 110 ms
* **Core count 9:** Approximately 100 ms
* **Core count 11:** Approximately 95 ms
* **Core count 13:** Approximately 90 ms
* **Core count 15:** Approximately 85 ms
* **Core count 17 to 47:** Approximately 50 ms
The trend shows a rapid decrease in time from 1 core to approximately 15 cores. After 15 cores, the time stabilizes around 50 ms.
### Key Observations
* The time decreases significantly as the core count increases from 1 to 15.
* Beyond 15 cores, the time remains relatively constant at approximately 50 ms.
* There is a diminishing return in performance gain as the core count increases beyond 15.
### Interpretation
The data suggests that increasing the core count initially leads to a significant reduction in processing time. However, after a certain point (around 15 cores in this case), adding more cores does not result in a substantial improvement in performance. This could be due to factors such as Amdahl's Law, where the sequential portion of the task limits the benefits of parallelization, or overhead associated with managing a large number of cores. The chart demonstrates the concept of diminishing returns in parallel computing, where the performance gains from adding more processors decrease as the number of processors increases.