## Bar Chart: Throughput Comparison
### Overview
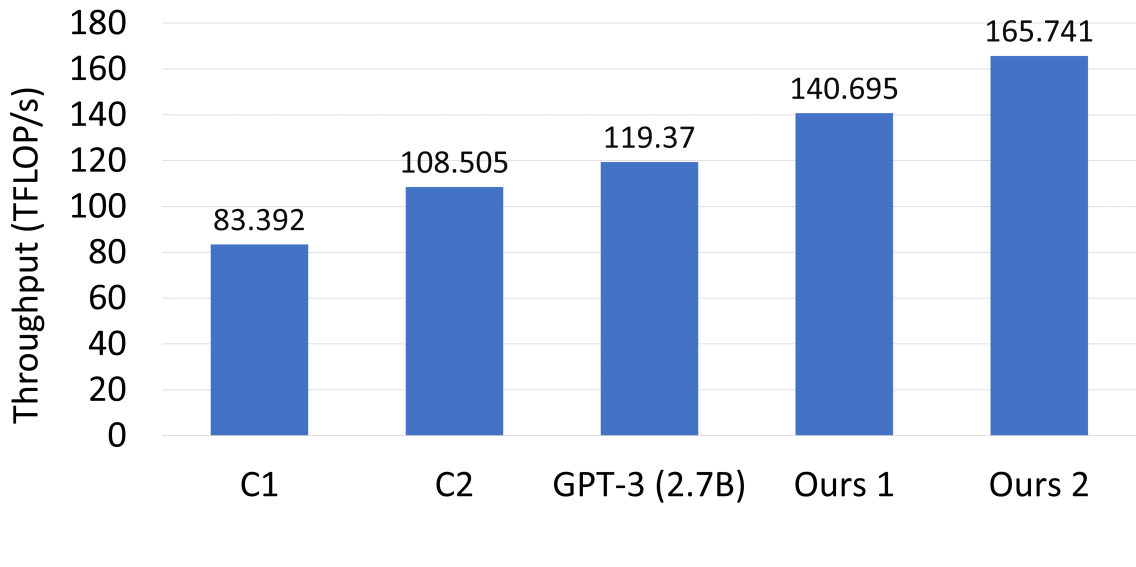
The image is a vertical bar chart illustrating the performance throughput (measured in TFLOP/s) of five distinct configurations or models. The chart displays a clear, ascending progression in performance from left to right, with the "Ours" configurations demonstrating the highest throughput values.
### Components/Axes
* **Y-Axis (Vertical):** Labeled "Throughput (TFLOP/s)". The scale ranges from 0 to 180, with horizontal grid lines marking increments of 20.
* **X-Axis (Horizontal):** Categorical labels for the five data points, listed from left to right: "C1", "C2", "GPT-3 (2.7B)", "Ours 1", and "Ours 2".
* **Data Series:** A single series of blue bars representing the throughput value for each category. The numerical value for each bar is printed directly above it.
### Detailed Analysis
The data is presented in ascending order of throughput. Below are the specific values extracted from the chart:
1. **C1 (Far Left):** The baseline configuration.
* **Value:** 83.392 TFLOP/s
2. **C2 (Second from Left):**
* **Value:** 108.505 TFLOP/s
3. **GPT-3 (2.7B) (Center):** A reference model benchmark.
* **Value:** 119.37 TFLOP/s
4. **Ours 1 (Second from Right):**
* **Value:** 140.695 TFLOP/s
5. **Ours 2 (Far Right):** The highest-performing configuration.
* **Value:** 165.741 TFLOP/s
### Key Observations
* **Trend:** There is a consistent, monotonic upward trend across all five categories.
* **Performance Gap:** The difference between the lowest performer ("C1") and the highest performer ("Ours 2") is 82.349 TFLOP/s, representing an approximate 98.7% increase in throughput.
* **Incremental Gains:**
* The jump from "C1" to "C2" is ~25.1 TFLOP/s.
* The jump from "C2" to "GPT-3 (2.7B)" is ~10.9 TFLOP/s.
* The jump from "GPT-3 (2.7B)" to "Ours 1" is ~21.3 TFLOP/s.
* The jump from "Ours 1" to "Ours 2" is ~25.0 TFLOP/s.
### Interpretation
This chart is a performance benchmark likely intended to demonstrate the efficacy of the authors' proposed methods ("Ours 1" and "Ours 2").
* **Benchmarking:** By including "GPT-3 (2.7B)" as a reference point, the authors provide a standard industry metric to contextualize their results.
* **Efficacy:** The fact that both "Ours" configurations significantly outperform the "GPT-3 (2.7B)" benchmark and the baseline "C1/C2" configurations suggests that the proposed methods offer substantial improvements in computational throughput.
* **Scaling:** The relatively consistent step-up in performance between the "Ours" variants suggests that the optimization techniques used are scalable or additive.