## Line Chart: Speedup Over 16 SMS vs. SM Count
### Overview
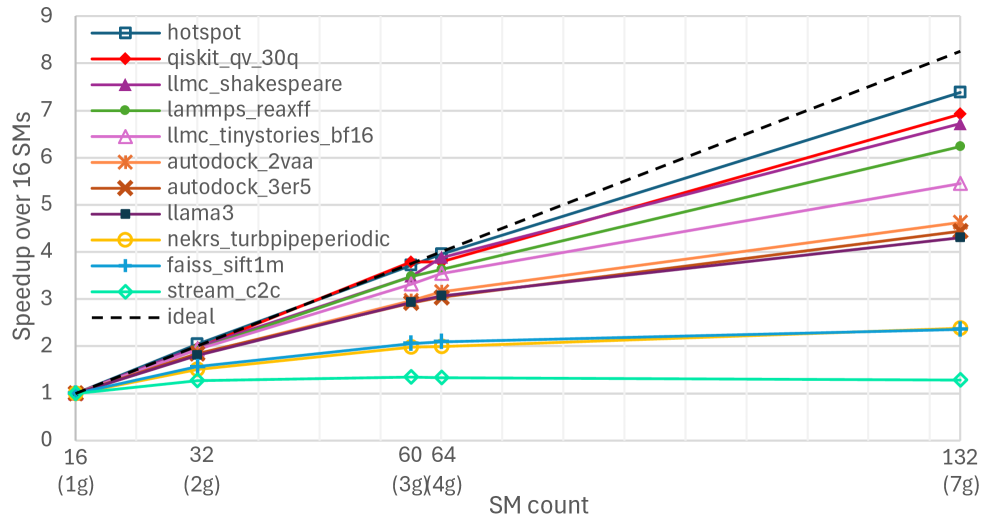
The chart compares the speedup performance of various computational systems (e.g., "hotspot," "qiskit_qv_30q," "llmc_shakespeare") over 16 SMS (Small Molecules) as the SM count increases. The x-axis categorizes SM counts into groups (1g, 2g, 3g(4g), 7g), while the y-axis measures speedup as a multiplier (0–9). A dashed black "ideal" line represents the theoretical maximum speedup.
### Components/Axes
- **X-axis (SM count)**: Categorized into 1g, 2g, 3g(4g), 7g.
- **Y-axis (Speedup over 16 SMS)**: Linear scale from 0 to 9.
- **Legend**: Located on the right, with 10 data series represented by distinct colors and markers:
- Blue squares: hotspot
- Red circles: qiskit_qv_30q
- Purple triangles: llmc_shakespeare
- Green diamonds: lammp_reaxff
- Pink triangles: llmc_tinystories_bf16
- Orange stars: autodock_2vaa
- Brown crosses: autodock_3er5
- Black diamonds: llama3
- Yellow circles: neikrs_turbpipeperiodic
- Cyan diamonds: stream_c2c
- Dashed black line: ideal
### Detailed Analysis
- **1g (16 SMs)**: All lines start near 1.0, with minimal variation.
- **2g (32 SMs)**:
- hotspot (blue squares) rises to ~2.0.
- qiskit_qv_30q (red circles) reaches ~2.2.
- stream_c2c (cyan diamonds) remains flat at ~1.2.
- **3g(4g) (64 SMs)**:
- hotspot peaks at ~4.0.
- qiskit_qv_30q reaches ~3.8.
- llmc_shakespeare (purple triangles) hits ~3.5.
- stream_c2c stays at ~1.2.
- **7g (132 SMs)**:
- hotspot: ~7.5.
- qiskit_qv_30q: ~6.8.
- llmc_shakespeare: ~6.5.
- lammp_reaxff (green diamonds): ~6.2.
- stream_c2c: ~1.2 (flat across all SM counts).
### Key Observations
1. **Ideal vs. Reality**: No system reaches the dashed "ideal" line, which grows linearly from 1.0 to ~8.5 at 7g.
2. **Outliers**:
- stream_c2c (cyan diamonds) shows no improvement, remaining at ~1.2.
- autodock_2vaa (orange stars) and autodock_3er5 (brown crosses) exhibit slower growth (~2.0–4.5 range).
3. **Trends**:
- Most systems show exponential growth, with hotspot and qiskit_qv_30q leading.
- llmc_shakespeare and lammp_reaxff follow closely behind.
- autodock systems lag, suggesting lower efficiency in scaling.
### Interpretation
The chart demonstrates that computational efficiency varies significantly across systems as SM count increases. The "ideal" line represents a linear scaling benchmark, but real-world systems exhibit sublinear or stagnant growth (e.g., stream_c2c). Systems like hotspot and qiskit_qv_30q achieve the highest speedups, suggesting superior optimization for large-scale SM computations. The flat performance of stream_c2c highlights a potential bottleneck or inefficiency in its design. These trends underscore the importance of system-specific optimizations for handling increasing computational loads.