## Line Chart: Fitness Value vs. Generation for Different Initial Populations
### Overview
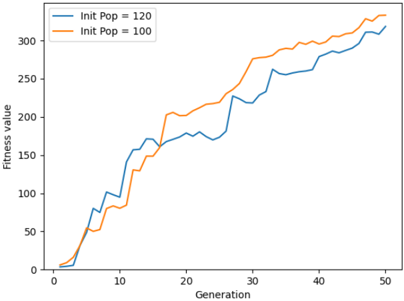
The image is a line chart comparing the fitness value over generations for two different initial population sizes: 120 and 100. The x-axis represents the generation number, and the y-axis represents the fitness value. The chart shows how the fitness value changes over 50 generations for each initial population.
### Components/Axes
* **X-axis:** Generation (0 to 50, increments of 10)
* **Y-axis:** Fitness value (0 to 300, increments of 50)
* **Legend (top-left):**
* Blue line: Init Pop = 120
* Orange line: Init Pop = 100
### Detailed Analysis
* **Blue Line (Init Pop = 120):**
* Trend: Generally increasing fitness value over generations.
* Data Points:
* Generation 0: ~0
* Generation 5: ~50
* Generation 10: ~100
* Generation 15: ~150
* Generation 20: ~170
* Generation 25: ~180
* Generation 30: ~230
* Generation 35: ~250
* Generation 40: ~280
* Generation 45: ~290
* Generation 50: ~320
* **Orange Line (Init Pop = 100):**
* Trend: Generally increasing fitness value over generations.
* Data Points:
* Generation 0: ~0
* Generation 5: ~50
* Generation 10: ~80
* Generation 15: ~140
* Generation 20: ~200
* Generation 25: ~220
* Generation 30: ~230
* Generation 35: ~280
* Generation 40: ~290
* Generation 45: ~300
* Generation 50: ~310
### Key Observations
* Both lines show an overall upward trend, indicating that the fitness value increases with each generation.
* The blue line (Init Pop = 120) initially increases more rapidly than the orange line (Init Pop = 100).
* Around generation 20, the orange line catches up to the blue line.
* From generation 35 onwards, the orange line (Init Pop = 100) appears to have a slightly higher fitness value than the blue line (Init Pop = 120).
### Interpretation
The chart suggests that the initial population size affects the fitness value over generations. A larger initial population (120) may lead to a faster initial increase in fitness, but a smaller initial population (100) can eventually catch up and potentially surpass the fitness value of the larger population. This could be due to factors such as genetic diversity or the ability to explore different solutions more effectively with a smaller population. The data indicates that while a larger initial population might provide an early advantage, it doesn't necessarily guarantee a higher fitness value in the long run.