## Line Graph: Run family (loops) Accuracy vs Training Steps
### Overview
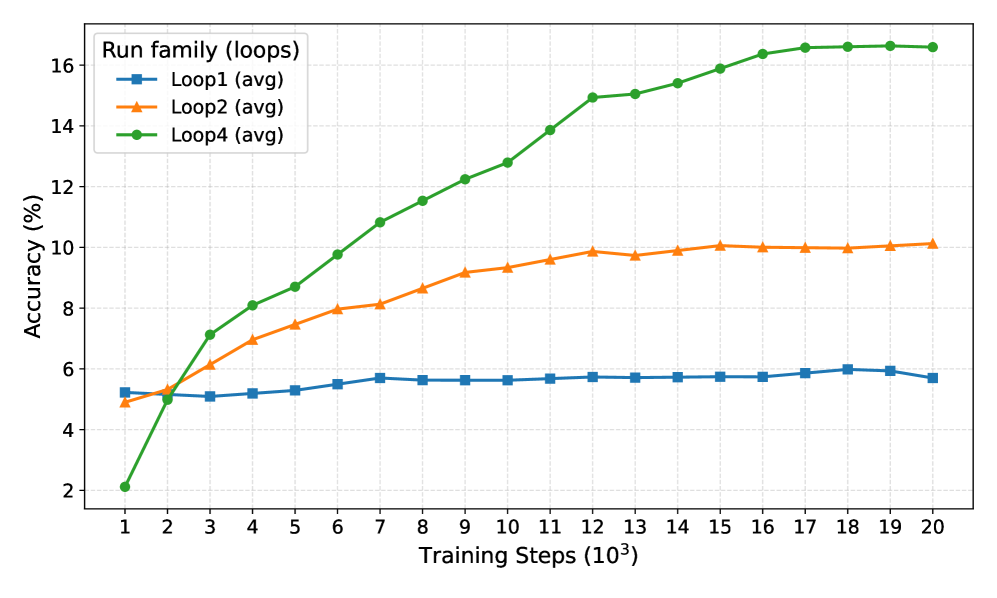
The image shows a line graph comparing the accuracy of three training loops (Loop1, Loop2, Loop4) across 20,000 training steps (in thousands). Accuracy is measured in percentage, with distinct line styles and colors for each loop family.
### Components/Axes
- **X-axis**: Training Steps (10³) ranging from 1 to 20 (in thousands)
- **Y-axis**: Accuracy (%) ranging from 2% to 16%
- **Legend**: Located in top-left corner, mapping:
- Blue squares: Loop1 (avg)
- Orange triangles: Loop2 (avg)
- Green circles: Loop4 (avg)
### Detailed Analysis
1. **Loop1 (blue squares)**:
- Starts at ~5% accuracy at 1k steps
- Remains relatively flat throughout training
- Ends at ~5.8% accuracy at 20k steps
- Trend: Minimal improvement (slope ≈ 0.0003% per step)
2. **Loop2 (orange triangles)**:
- Begins at ~4.8% accuracy at 1k steps
- Shows steady improvement until ~12k steps
- Plateaus at ~10% accuracy from 12k to 20k steps
- Peak accuracy: ~10.2% at 15k steps
- Trend: Initial slope ≈ 0.0005% per step, then flattening
3. **Loop4 (green circles)**:
- Starts at 2% accuracy at 1k steps
- Rapid improvement until ~12k steps
- Reaches ~16.2% accuracy by 16k steps
- Maintains ~16.2% accuracy through 20k steps
- Trend: Initial slope ≈ 0.001% per step, then plateau
### Key Observations
- Loop4 demonstrates the most significant improvement, achieving 3x higher accuracy than Loop1 by 20k steps
- Loop2 shows moderate gains but plateaus earlier than Loop4
- All loops exhibit diminishing returns after ~12k steps
- Loop1 remains the least effective throughout training
### Interpretation
The data suggests Loop4's training methodology is most effective for accuracy optimization, achieving near-maximal performance by 16k steps. Loop2 demonstrates moderate effectiveness but experiences diminishing returns earlier than Loop4. Loop1's stagnant performance indicates potential limitations in its training approach. The convergence of Loop2 and Loop4 at ~10% accuracy suggests possible architectural similarities between these implementations. The plateauing patterns across all loops after 12k steps may indicate a saturation point in the training data's capacity to improve model performance further.