## Stacked Time-Series Line Charts: Bifurcation and State Dynamics
### Overview
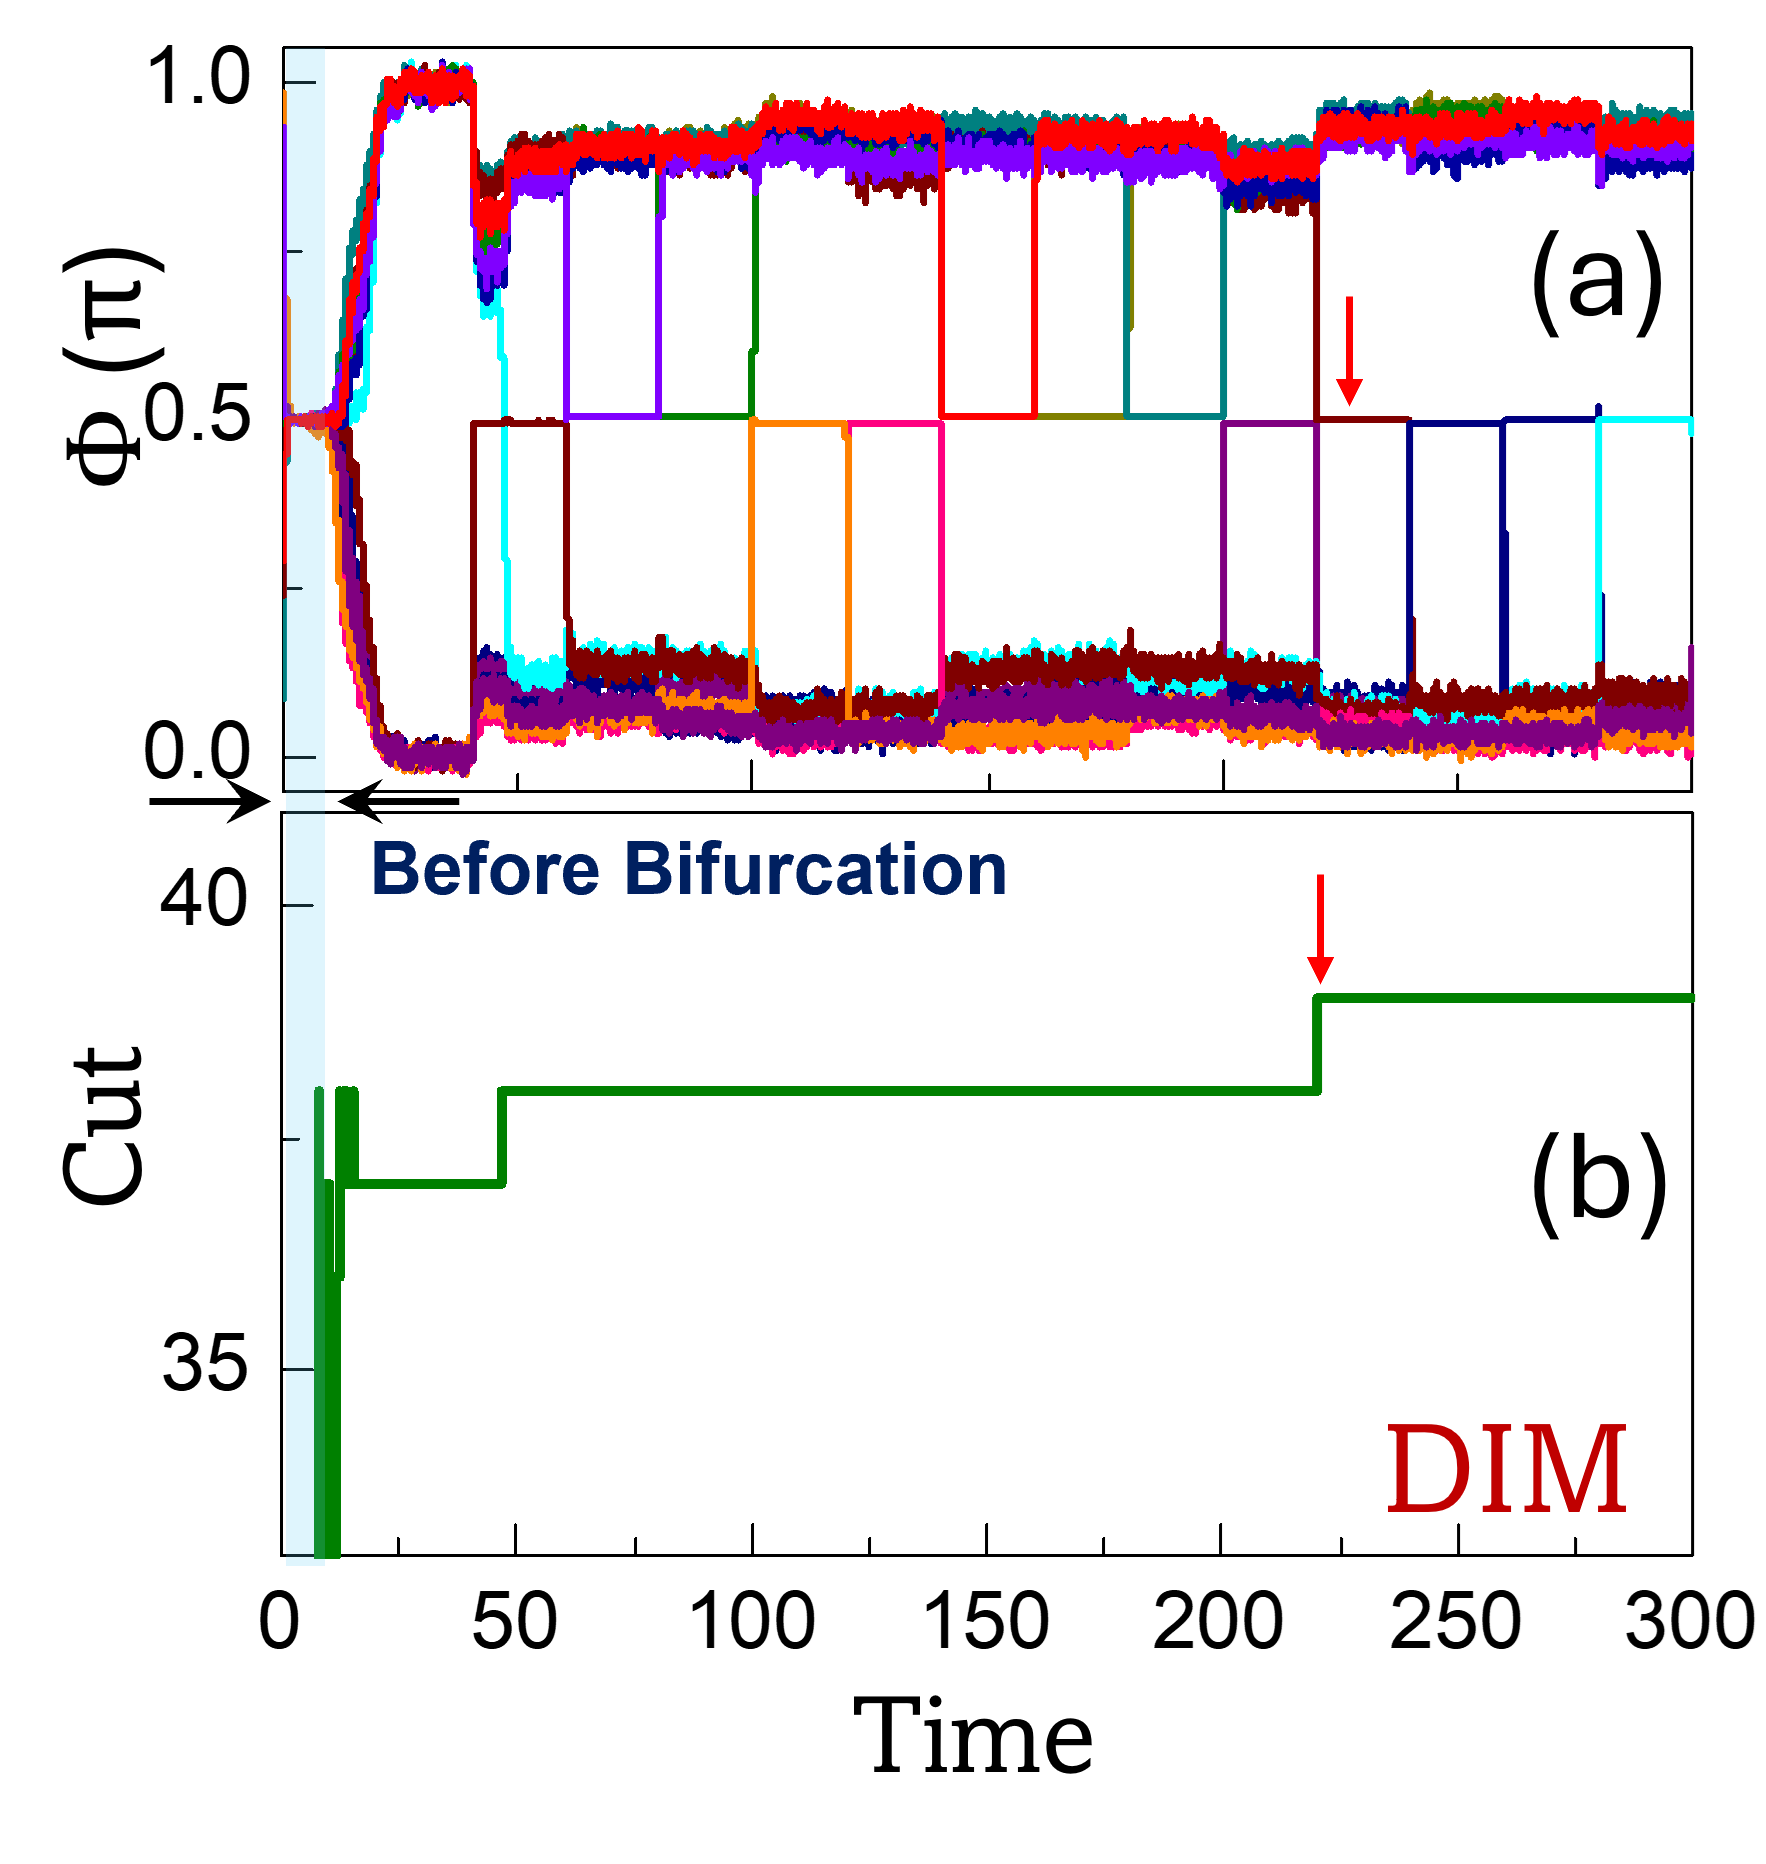
This image displays two vertically stacked line charts sharing a common horizontal axis labeled "Time" (ranging from 0 to 300). The charts illustrate the temporal evolution of a system, likely a dynamical or multi-agent system, undergoing a bifurcation event.
* **Top Chart (a):** Tracks the phase variable $\Phi (\pi)$ for multiple entities over time.
* **Bottom Chart (b):** Tracks a variable labeled "Cut" over time.
A light blue shaded region on the far left (Time 0 to ~15) is annotated as "Before Bifurcation." Red arrows at Time $\approx 220$ indicate a synchronized event across both charts.
### Components/Axes
**Shared Horizontal Axis:**
* **Label:** "Time"
* **Scale:** 0 to 300, with major ticks every 50 units.
**Top Chart (a):**
* **Vertical Axis:** Labeled "$\Phi (\pi)$". Scale ranges from 0.0 to 1.0.
* **Data Series:** Multiple overlapping lines of various colors (red, blue, green, purple, orange, cyan, dark red). These lines represent the state of individual agents or components.
* **Annotations:** A red arrow points downward at Time $\approx 220$.
**Bottom Chart (b):**
* **Vertical Axis:** Labeled "Cut". Scale ranges from 35 to 40.
* **Data Series:** A single green line representing the "Cut" value.
* **Annotations:** A red arrow points upward at Time $\approx 220$. The text "DIM" appears in the bottom-right corner.
### Detailed Analysis
**1. Phase 1: Pre-Bifurcation (Time 0 to ~15)**
* **Chart (a):** All colored lines are clustered at a value of 0.5.
* **Chart (b):** The "Cut" value starts at 0, then exhibits a sharp, vertical jump to approximately 36.
**2. Phase 2: Post-Bifurcation (Time ~15 to ~220)**
* **Chart (a):** The system bifurcates. The lines diverge from the 0.5 state, splitting into distinct groups: some lines jump to 1.0, others drop to 0.0, and some remain at 0.5. Throughout this period, the lines exhibit discrete "switching" behavior, jumping between 0.0, 0.5, and 1.0 at various time intervals.
* **Chart (b):** The "Cut" value remains relatively stable at ~36, then steps up to ~37 at Time $\approx 55$. It remains at ~37 until the next event.
**3. Phase 3: Event at Time $\approx 220$**
* **Chart (a):** Marked by the red arrow. There is a noticeable reorganization of the lines. Several lines that were at 0.5 or 0.0 shift to 1.0, and others shift to 0.5.
* **Chart (b):** Marked by the red arrow. The "Cut" value steps up from ~37 to approximately 38.5.
### Key Observations
* **Correlation:** There is a clear correlation between the "Cut" value and the state of the $\Phi$ variables. Increases in the "Cut" value (the green line) appear to trigger or coincide with state transitions in the $\Phi$ variables.
* **Bifurcation:** The transition at Time $\approx 15$ is the most significant event, where the system moves from a uniform state (0.5) to a bifurcated state (0.0, 0.5, 1.0).
* **Discrete States:** The $\Phi$ variable is quantized, restricted to three distinct levels: 0.0, 0.5, and 1.0.
* **Step-wise Progression:** The "Cut" variable behaves as a step function, suggesting it may be a control parameter that is incremented periodically.
### Interpretation
The data suggests this is a simulation of a complex system, possibly related to **network synchronization, community detection, or phase transitions in coupled oscillators**.
* **"Cut" as a Control Parameter:** The "Cut" variable likely represents a global constraint or a threshold parameter (common in graph partitioning or community detection algorithms). As this parameter increases, the system is forced to reorganize its internal states ($\Phi$).
* **Bifurcation:** The initial jump at Time $\approx 15$ represents a phase transition where the system loses its initial symmetry.
* **DIM:** The label "DIM" in the bottom right likely refers to "Dimensionality" or the specific model/algorithm name (e.g., a Dimensionality reduction technique or a specific simulation model).
* **System Stability:** The system appears to reach a quasi-stable state after each "Cut" increment, where the $\Phi$ values fluctuate within a specific band until the next "Cut" increment forces a new configuration.