TECHNICAL ASSET FINGERPRINT
7b75f693fccd153822bd8f39
Click to view fullscreen
Press ESC or click to close
FOUND IN PAPERS
EXPERT: gemma-3-27b-it-free VERSION 1
RUNTIME: google-free/gemma-3-27b-it
INTEL_VERIFIED
\n
## Charts: Performance vs Compute Budget & Performance vs Steps
### Overview
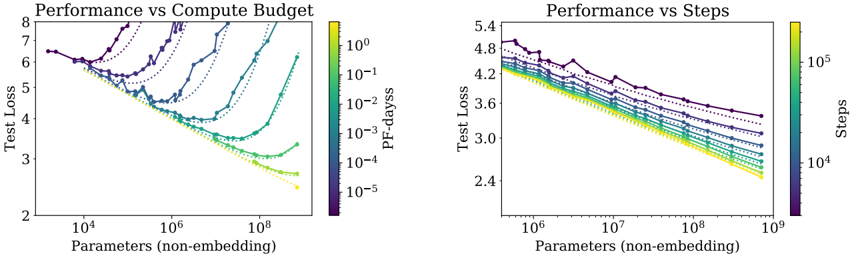
The image contains two charts, both depicting performance (Test Loss) against model size (Parameters (non-embedding)). The left chart shows performance against compute budget (PF-days), while the right chart shows performance against training steps. Both charts use color to represent a third variable, allowing for a multi-dimensional view of the data.
### Components/Axes
**Common Elements:**
* **Y-axis Label:** "Test Loss" (Scale ranges from approximately 2 to 8 in the left chart and 2.4 to 5.4 in the right chart).
* **X-axis Label:** "Parameters (non-embedding)" (Logarithmic scale. Left chart ranges from approximately 10<sup>4</sup> to 10<sup>9</sup>. Right chart ranges from approximately 10<sup>6</sup> to 10<sup>9</sup>).
**Left Chart:**
* **Title:** "Performance vs Compute Budget"
* **Colorbar Label:** "PF-days" (Logarithmic scale, ranging from approximately 10<sup>-5</sup> to 10<sup>0</sup>).
* **Lines:** Multiple lines representing different models or configurations.
**Right Chart:**
* **Title:** "Performance vs Steps"
* **Colorbar Label:** "Steps" (Logarithmic scale, ranging from approximately 10<sup>4</sup> to 10<sup>5</sup>).
* **Lines:** Multiple lines representing different models or configurations.
### Detailed Analysis or Content Details
**Left Chart: Performance vs Compute Budget**
The chart displays several lines, each representing a different model or training configuration. The lines generally show a decreasing trend in Test Loss as the number of Parameters increases, indicating improved performance. The color of each line corresponds to the compute budget (PF-days) used for training, as indicated by the colorbar on the right.
* **Dark Purple Line:** Starts at approximately 7.2 Test Loss at 10<sup>4</sup> Parameters, fluctuates, and ends at approximately 3.2 Test Loss at 10<sup>9</sup> Parameters. Represents a high compute budget (PF-days ≈ 10<sup>0</sup>).
* **Blue Line:** Starts at approximately 6.5 Test Loss at 10<sup>4</sup> Parameters, decreases steadily, and ends at approximately 2.8 Test Loss at 10<sup>9</sup> Parameters. Represents a medium-high compute budget (PF-days ≈ 10<sup>-1</sup>).
* **Green Line:** Starts at approximately 5.5 Test Loss at 10<sup>4</sup> Parameters, decreases steadily, and ends at approximately 2.5 Test Loss at 10<sup>9</sup> Parameters. Represents a medium compute budget (PF-days ≈ 10<sup>-2</sup>).
* **Yellow Line:** Starts at approximately 4.5 Test Loss at 10<sup>4</sup> Parameters, decreases rapidly, and ends at approximately 2.3 Test Loss at 10<sup>9</sup> Parameters. Represents a low compute budget (PF-days ≈ 10<sup>-3</sup>).
* **Light Yellow Line:** Starts at approximately 3.8 Test Loss at 10<sup>4</sup> Parameters, decreases rapidly, and ends at approximately 2.2 Test Loss at 10<sup>9</sup> Parameters. Represents a very low compute budget (PF-days ≈ 10<sup>-4</sup>).
**Right Chart: Performance vs Steps**
This chart shows a similar trend, with Test Loss decreasing as the number of Parameters increases. The color of each line corresponds to the number of training steps taken, as indicated by the colorbar on the right.
* **Dark Purple Line:** Starts at approximately 4.9 Test Loss at 10<sup>6</sup> Parameters, fluctuates, and ends at approximately 3.8 Test Loss at 10<sup>9</sup> Parameters. Represents a low number of steps (Steps ≈ 10<sup>4</sup>).
* **Blue Line:** Starts at approximately 4.7 Test Loss at 10<sup>6</sup> Parameters, decreases steadily, and ends at approximately 3.4 Test Loss at 10<sup>9</sup> Parameters. Represents a medium-low number of steps (Steps ≈ 2 x 10<sup>4</sup>).
* **Green Line:** Starts at approximately 4.5 Test Loss at 10<sup>6</sup> Parameters, decreases steadily, and ends at approximately 3.2 Test Loss at 10<sup>9</sup> Parameters. Represents a medium number of steps (Steps ≈ 4 x 10<sup>4</sup>).
* **Yellow Line:** Starts at approximately 4.3 Test Loss at 10<sup>6</sup> Parameters, decreases rapidly, and ends at approximately 3.0 Test Loss at 10<sup>9</sup> Parameters. Represents a medium-high number of steps (Steps ≈ 6 x 10<sup>4</sup>).
* **Light Yellow Line:** Starts at approximately 4.1 Test Loss at 10<sup>6</sup> Parameters, decreases rapidly, and ends at approximately 2.8 Test Loss at 10<sup>9</sup> Parameters. Represents a high number of steps (Steps ≈ 8 x 10<sup>4</sup>).
### Key Observations
* In both charts, increasing the number of Parameters generally leads to lower Test Loss.
* In the left chart, higher compute budgets (PF-days) tend to result in slightly higher initial Test Loss but potentially more stable training.
* In the right chart, a higher number of training steps generally leads to lower Test Loss.
* The lines representing lower compute budgets (left chart) and higher steps (right chart) show the most rapid decrease in Test Loss.
* There is some variation in performance between different models or configurations, even with similar compute budgets or training steps.
### Interpretation
These charts demonstrate the trade-offs between model size, compute budget, training steps, and performance. Increasing model size (Parameters) generally improves performance (lower Test Loss). However, the optimal balance depends on the available compute resources and training time.
The left chart suggests that while higher compute budgets don't necessarily guarantee the lowest Test Loss, they can lead to more stable training and potentially better generalization. The right chart highlights the importance of sufficient training steps to achieve optimal performance.
The color gradients in both charts provide valuable insights into the relationship between these factors. For example, the left chart shows that models trained with lower compute budgets can achieve comparable performance to those trained with higher budgets, but they may require more careful tuning or regularization. The right chart shows that increasing the number of steps can improve performance, but there may be diminishing returns beyond a certain point.
The variation between the lines suggests that other factors, such as model architecture or hyperparameter settings, also play a significant role in determining performance. Further investigation would be needed to understand these factors and optimize model training for specific applications.
DECODING INTELLIGENCE...