## Scatter Plot: Relationship of Space Size and Gap Ratio
### Overview
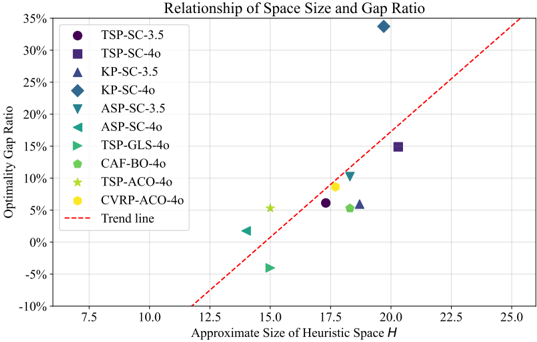
The image is a scatter plot illustrating the relationship between the approximate size of heuristic space (H) and the optimality gap ratio. Data points are plotted with distinct symbols and colors corresponding to different algorithms or configurations. A red dashed trend line indicates a general positive correlation between heuristic space size and optimality gap ratio.
### Components/Axes
- **X-axis**: "Approximate Size of Heuristic Space H" (range: 7.5 to 25.0)
- **Y-axis**: "Optimality Gap Ratio" (range: -10% to 35%)
- **Legend**: Located in the top-left corner, with the following entries:
- TSP-SC-3.5 (purple circle)
- TSP-SC-4o (purple square)
- KP-SC-3.5 (blue triangle)
- KP-SC-4o (blue diamond)
- ASP-SC-3.5 (teal triangle)
- ASP-SC-4o (teal triangle)
- TSP-GLS-4o (green triangle)
- CAF-BO-4o (green star)
- TSP-ACO-4o (green star)
- CVRP-ACO-4o (yellow hexagon)
- **Trend Line**: Red dashed line with a positive slope, starting near (7.5, -10%) and ending near (25.0, 35%).
### Detailed Analysis
- **Data Points**:
- **TSP-SC-3.5** (purple circle): ~(17.5, 5%)
- **TSP-SC-4o** (purple square): ~(20, 15%)
- **KP-SC-3.5** (blue triangle): ~(12.5, 0%)
- **KP-SC-4o** (blue diamond): ~(19, 30%)
- **ASP-SC-3.5** (teal triangle): ~(15, -5%)
- **ASP-SC-4o** (teal triangle): ~(17.5, 10%)
- **TSP-GLS-4o** (green triangle): ~(16, 5%)
- **CAF-BO-4o** (green star): ~(14, 5%)
- **TSP-ACO-4o** (green star): ~(18, 8%)
- **CVRP-ACO-4o** (yellow hexagon): ~(17, 9%)
- **Trend Line**: The red dashed line shows a clear upward trend, suggesting that larger heuristic spaces generally correlate with higher optimality gap ratios. However, some data points deviate from this trend (e.g., ASP-SC-3.5 at -5%).
### Key Observations
1. **Positive Correlation**: Most data points align with the trend line, indicating that larger heuristic spaces (H) tend to result in higher optimality gap ratios.
2. **Outliers**:
- **ASP-SC-3.5** (teal triangle) at (15, -5%) is below the trend line, suggesting an anomaly.
- **KP-SC-4o** (blue diamond) at (19, 30%) is significantly above the trend line, indicating a high optimality gap for its heuristic space size.
3. **Clustered Data**: Points for TSP-SC-3.5, TSP-SC-4o, and TSP-ACO-4o are clustered around heuristic space sizes of 17.5–20, with optimality gaps between 5% and 15%.
### Interpretation
The chart demonstrates that heuristic space size (H) has a measurable impact on optimality gap ratios, with larger spaces generally leading to higher gaps. However, the presence of outliers (e.g., ASP-SC-3.5 and KP-SC-4o) suggests that other factors (e.g., algorithm-specific parameters or problem instances) may influence the relationship. The trend line provides a general guideline, but individual algorithm performance varies. For example, KP-SC-4o’s high gap ratio at a moderate heuristic space size (19) could indicate inefficiencies in that specific configuration. The negative gap for ASP-SC-3.5 (-5%) might reflect over-optimization or a unique problem setup. This analysis highlights the need for further investigation into the factors driving these deviations.