\n
## Chart: Cumulative Number of Non-Missing Stations & Number of Non-Missing Stations Over Time
### Overview
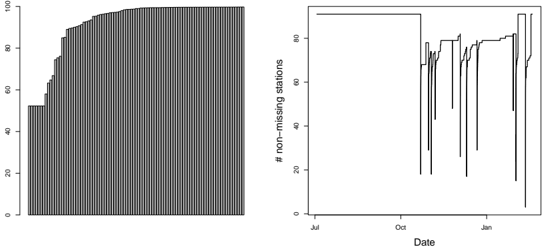
The image presents two time-series charts displayed side-by-side. The chart on the left shows the cumulative number of non-missing stations over time, while the chart on the right displays the number of non-missing stations as a function of date. Both charts appear to cover a period from approximately July to January.
### Components/Axes
**Left Chart:**
* **Y-axis:** Labeled "Cumulative Number of Stations", ranging from 0 to 100, with markings at 20, 40, 60, 80, and 100.
* **X-axis:** Labeled "Date", with no explicit markings, but representing a time span from approximately July to January.
* **Data Series:** A single series represented by vertical bars, showing the cumulative count.
**Right Chart:**
* **Y-axis:** Labeled "# non-missing stations", ranging from 0 to 80, with markings at 20, 40, 60, and 80.
* **X-axis:** Labeled "Date", with markings for "Jul", "Oct", and "Jan".
* **Data Series:** A single line plot representing the number of non-missing stations over time.
### Detailed Analysis or Content Details
**Left Chart (Cumulative Number of Stations):**
The cumulative number of stations starts at approximately 10 at the beginning of the period (July). It increases in a stepwise fashion, with periods of no change followed by relatively rapid increases. By approximately October, the cumulative number reaches around 50. The growth continues, and by January, the cumulative number of stations reaches approximately 95.
**Right Chart (Number of Non-Missing Stations):**
The number of non-missing stations fluctuates significantly over time.
* **July - October:** The line starts at approximately 20 in July, increases to around 70 by October, with several dips and peaks in between.
* **October - December:** The line fluctuates between approximately 60 and 80 stations.
* **December - January:** A sharp decrease occurs around December, dropping to approximately 20 stations, followed by a recovery to around 75 stations by January.
### Key Observations
* The cumulative number of stations (left chart) consistently increases over time, indicating a growing network of stations.
* The number of non-missing stations (right chart) exhibits high variability, suggesting periods of station outages or data loss.
* The sharp drop in non-missing stations around December (right chart) is a notable anomaly, potentially indicating a widespread issue affecting station availability.
* The right chart shows a clear seasonal pattern, with a general increase in the number of non-missing stations from July to October, followed by a decline in December and a partial recovery in January.
### Interpretation
The data suggests a network of stations is being progressively deployed or becoming operational (left chart). However, the operational stability of these stations is variable (right chart). The fluctuations in the number of non-missing stations could be due to various factors, such as maintenance, weather conditions, or technical failures. The significant drop in December warrants further investigation, as it could indicate a systemic problem affecting a large portion of the network. The seasonal pattern observed in the right chart might be related to environmental factors that impact station performance, such as winter weather. The two charts together provide a comprehensive view of both the growth and reliability of the station network.