\n
## Diagram: Causal Models and Semi-Algebraic Sets
### Overview
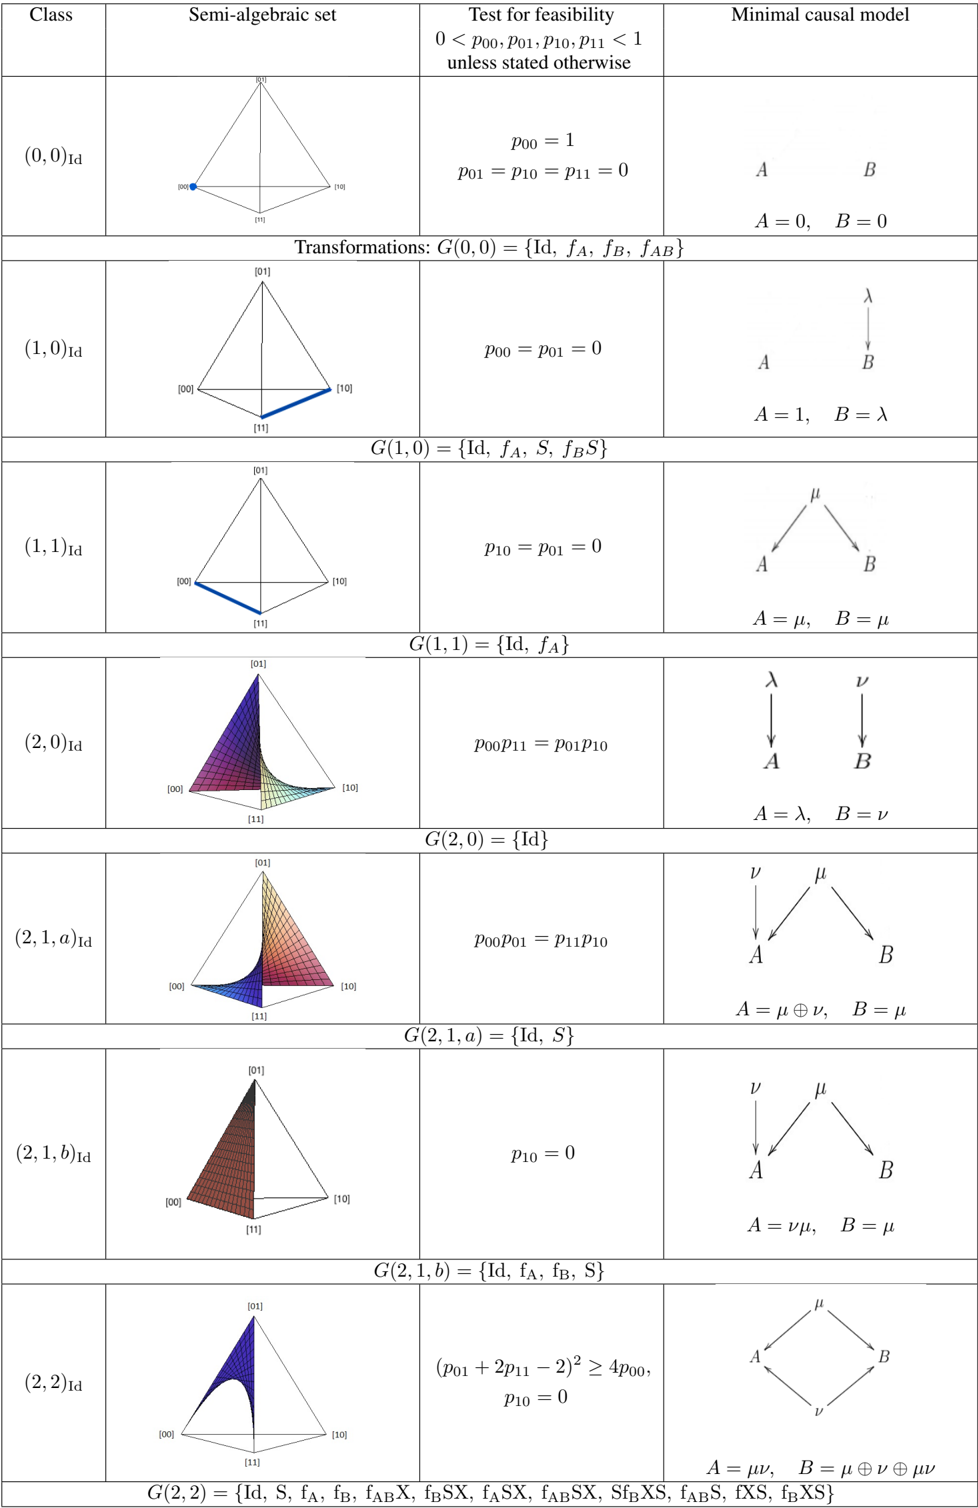
The image presents a series of diagrams illustrating different causal models, their corresponding semi-algebraic sets, tests for feasibility, and minimal causal models. The diagram is organized into six rows, each representing a different class of causal model. Each row contains a 3D plot (semi-algebraic set), a feasibility test, and a simplified causal diagram.
### Components/Axes
The diagram is structured in columns:
* **Class:** Labels the causal model type (e.g., (0,0)<sub>Id</sub>, (1,1)<sub>Id</sub>, etc.).
* **Semi-algebraic set:** A 3D plot with axes labeled [00], [01], and [11] (or [10] in some cases). The plots appear to represent regions defined by inequalities.
* **Test for feasibility:** Mathematical conditions that must be met for the model to be valid. These conditions involve probabilities denoted as p<sub>00</sub>, p<sub>01</sub>, p<sub>10</sub>, and p<sub>11</sub>.
* **Minimal causal model:** A simplified diagram showing the causal relationships between variables A and B, often with Greek letters representing causal effects.
### Detailed Analysis or Content Details
**Row 1: (0,0)<sub>Id</sub>**
* **Semi-algebraic set:** A flat plane.
* **Test for feasibility:** 0 < p<sub>00</sub>, p<sub>01</sub>, p<sub>10</sub>, p<sub>11</sub> < 1 unless stated otherwise. p<sub>00</sub> = 1 and p<sub>01</sub> = p<sub>10</sub> = p<sub>11</sub> = 0.
* **Transformations:** G(0,0) = {Id, f<sub>A</sub>, f<sub>B</sub>, f<sub>AB</sub>}
* **Minimal causal model:** A and B are independent, represented by two unconnected nodes labeled A and B. A = 0, B = 0.
**Row 2: (1,0)<sub>Id</sub>**
* **Semi-algebraic set:** A triangular region.
* **Test for feasibility:** p<sub>00</sub> = p<sub>01</sub> = 0.
* **Transformations:** G(1,0) = {Id, f<sub>A</sub>, S, f<sub>B</sub>S}
* **Minimal causal model:** A causes B, represented by an arrow from A to B. A = 1, B = λ.
**Row 3: (1,1)<sub>Id</sub>**
* **Semi-algebraic set:** A triangular region.
* **Test for feasibility:** p<sub>10</sub> = p<sub>01</sub> = 0.
* **Transformations:** G(1,1) = {Id, f<sub>A</sub>}
* **Minimal causal model:** A causes B, represented by an arrow from A to B. A = μ, B = μ.
**Row 4: (2,0)<sub>Id</sub>**
* **Semi-algebraic set:** A more complex 3D shape.
* **Test for feasibility:** p<sub>00</sub>p<sub>11</sub> = p<sub>01</sub>p<sub>10</sub>.
* **Transformations:** G(2,0) = {Id}
* **Minimal causal model:** A and B are independent, represented by two unconnected nodes labeled A and B. A = λ, B = ν.
**Row 5: (2,1,α)<sub>Id</sub>**
* **Semi-algebraic set:** A more complex 3D shape.
* **Test for feasibility:** p<sub>00</sub>p<sub>01</sub> = p<sub>11</sub>p<sub>10</sub>.
* **Transformations:** G(2,1,α) = {Id, S}
* **Minimal causal model:** A causes B, represented by an arrow from A to B. A = μ + ρυ, B = μ.
**Row 6: (2,2)<sub>Id</sub>**
* **Semi-algebraic set:** A complex 3D shape.
* **Test for feasibility:** (p<sub>01</sub> + 2p<sub>11</sub> - 2)<sup>2</sup> ≥ 4p<sub>00</sub>, p<sub>10</sub> = 0.
* **Transformations:** G(2,2) = {Id, S, f<sub>A</sub>, f<sub>AB</sub>X, f<sub>BS</sub>X, f<sub>AS</sub>X, f<sub>AB</sub>XS, S<sub>fB</sub>XS, f<sub>XS</sub>, f<sub>fXS</sub>}
* **Minimal causal model:** A causes B, and B causes A, represented by bidirectional arrows between A and B. A = μ, B = μ + ρυ.
### Key Observations
* The complexity of the semi-algebraic set generally increases with the complexity of the causal model.
* The feasibility tests provide mathematical constraints on the probabilities that define the relationships between variables.
* The minimal causal models offer a simplified visual representation of the causal relationships.
* The transformations (G(x,y,z)) appear to represent operations or functions applied to the variables.
### Interpretation
This diagram illustrates the connection between causal models, their mathematical representation as semi-algebraic sets, and their simplified visual representation as causal diagrams. The feasibility tests define the conditions under which these models are valid, based on probabilistic constraints. The transformations suggest the operations that can be performed on the variables within each model. The diagram demonstrates how complex causal relationships can be represented and analyzed using mathematical and graphical tools. The use of Greek letters (λ, μ, ν, ρ) in the minimal causal models likely represents specific causal parameters or effects. The notation "Id" likely refers to the identity transformation. The "S" transformation is not explicitly defined but appears to represent some form of intervention or manipulation. The increasing complexity of the transformations with each row suggests a growing level of intervention or manipulation required to define the causal relationships. The diagram is a formalization of causal inference, linking mathematical conditions to graphical representations of causal structures.