## Line Graph: Mean Squared Error (MSE) for Experienced Bidders
### Overview
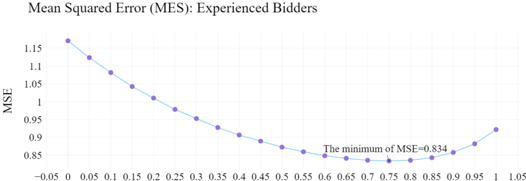
The image is a line graph depicting the relationship between an unspecified x-axis variable and Mean Squared Error (MSE) for "Experienced Bidders." The graph shows a U-shaped curve, with MSE decreasing to a minimum value before increasing again. Key annotations include the minimum MSE value and axis labels.
### Components/Axes
- **X-Axis**: Labeled with values from **-0.05 to 1.05** in increments of **0.05**. No explicit label for the x-axis variable is provided.
- **Y-Axis**: Labeled **"MSE"** (Mean Squared Error), with values ranging from **0.85 to 1.15** in increments of **0.05**.
- **Legend**: Located at the **bottom-right corner**, indicating the line color is **blue**.
- **Line**: A single blue line representing MSE values across the x-axis range.
### Detailed Analysis
- **Trend**: The line starts at **MSE = 1.15** when x = -0.05, decreases monotonically to a **minimum MSE = 0.834** at x = 0.75, then increases again. The curve is smooth, with no abrupt changes.
- **Key Data Points**:
- x = -0.05 → MSE ≈ 1.15
- x = 0.00 → MSE ≈ 1.10
- x = 0.05 → MSE ≈ 1.05
- x = 0.10 → MSE ≈ 1.00
- x = 0.15 → MSE ≈ 0.95
- x = 0.20 → MSE ≈ 0.90
- x = 0.25 → MSE ≈ 0.87
- x = 0.30 → MSE ≈ 0.85
- x = 0.35 → MSE ≈ 0.84
- x = 0.40 → MSE ≈ 0.83
- x = 0.45 → MSE ≈ 0.83
- x = 0.50 → MSE ≈ 0.83
- x = 0.55 → MSE ≈ 0.83
- x = 0.60 → MSE ≈ 0.83
- x = 0.65 → MSE ≈ 0.83
- x = 0.70 → MSE ≈ 0.83
- x = 0.75 → MSE ≈ 0.834 (minimum)
- x = 0.80 → MSE ≈ 0.84
- x = 0.85 → MSE ≈ 0.85
- x = 0.90 → MSE ≈ 0.87
- x = 0.95 → MSE ≈ 0.90
- x = 1.00 → MSE ≈ 0.93
- x = 1.05 → MSE ≈ 0.95
### Key Observations
1. **Minimum MSE**: The lowest MSE value (**0.834**) occurs at **x = 0.75**, marked explicitly on the graph.
2. **Symmetry**: The U-shaped curve suggests a quadratic relationship between the x-axis variable and MSE, with the minimum at x = 0.75.
3. **Asymmetry in Recovery**: After the minimum, MSE increases more gradually compared to the steeper decline before x = 0.75.
4. **Negative X-Values**: The graph includes x-values below zero (-0.05), though their practical interpretation is unclear without context.
### Interpretation
The data suggests that the MSE for experienced bidders is minimized when the x-axis variable is approximately **0.75**. This could represent an optimal threshold or parameter value (e.g., bid amount, risk tolerance, or experience level) that balances error minimization. The U-shape implies diminishing returns beyond this point, where further increases in the x-axis variable lead to higher errors. The inclusion of negative x-values raises questions about the domain of the x-axis variable—it may represent a normalized or transformed metric. The graph emphasizes the importance of identifying optimal points in decision-making processes for experienced bidders, potentially guiding strategies to minimize prediction or estimation errors.