\n
## Diagram: LLM Response and Fact-Check Flow
### Overview
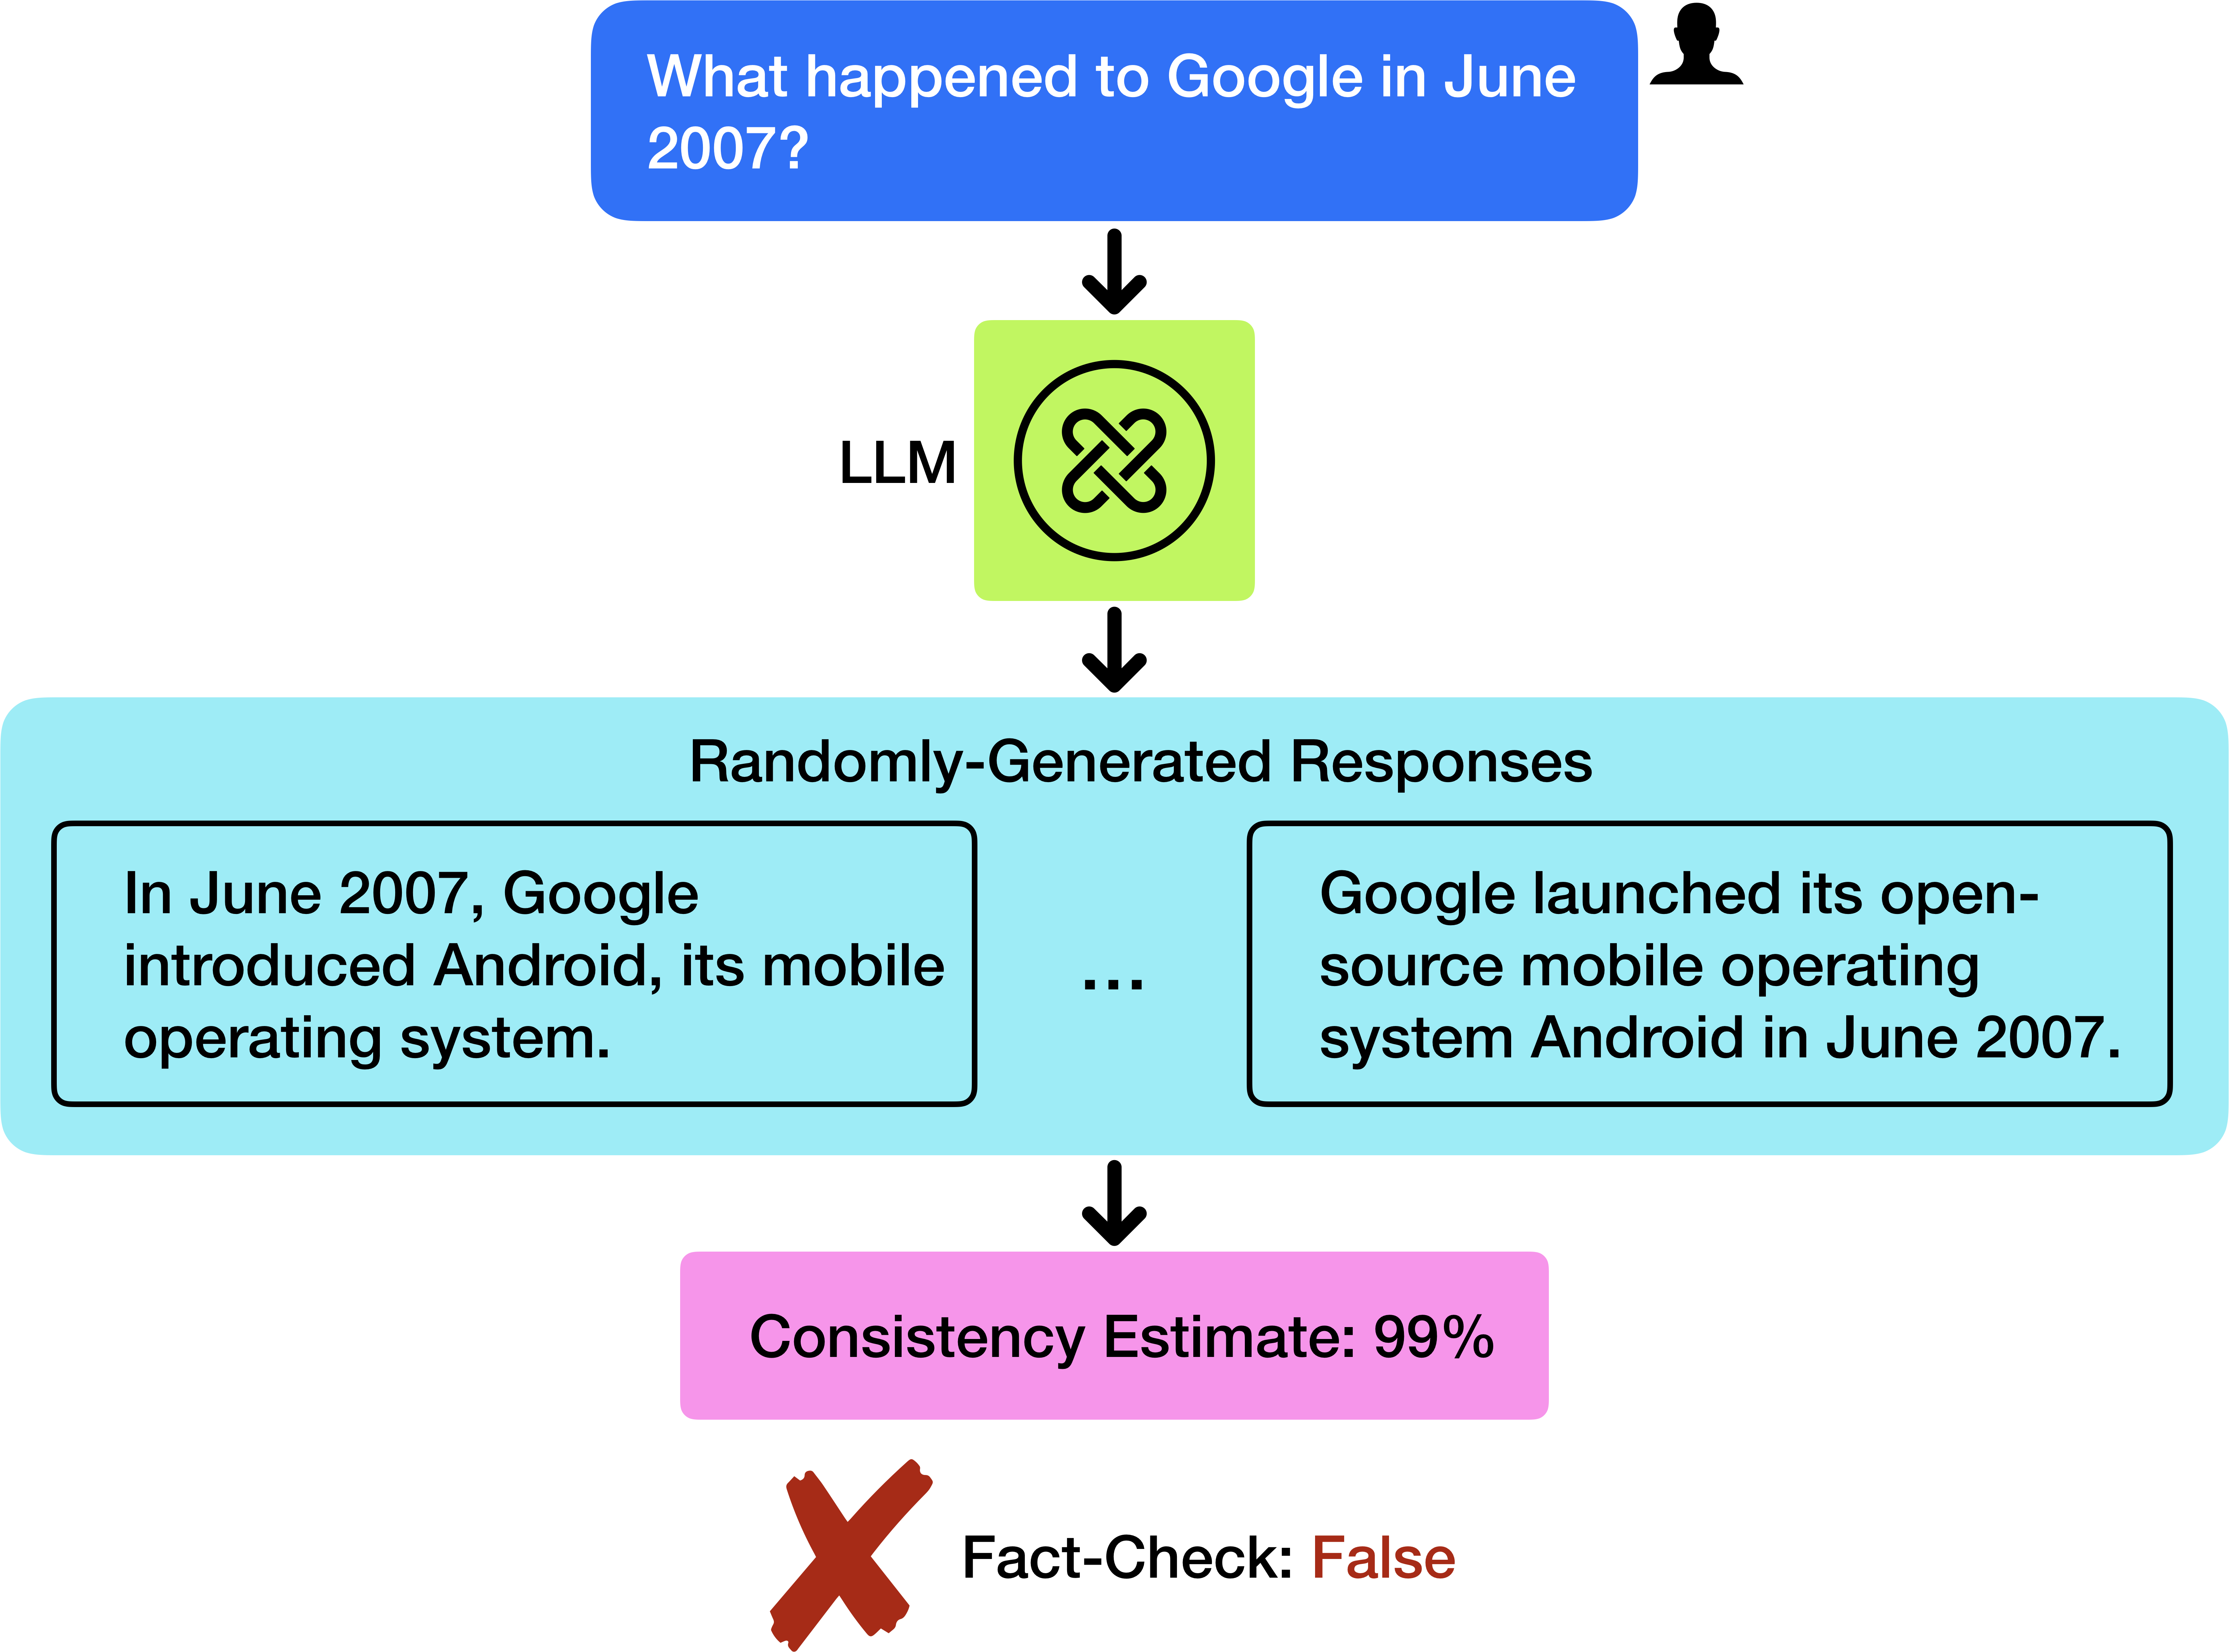
This diagram illustrates the process of a Large Language Model (LLM) responding to a query, generating multiple responses, and then undergoing a fact-check. The diagram highlights a scenario where the LLM generates a response that, despite high consistency, is factually incorrect.
### Components/Axes
The diagram consists of the following components, arranged vertically:
1. **Input Query:** A blue rectangular box at the top, containing the text "What happened to Google in June 2007?". A small user icon is present in the top-right corner of this box.
2. **LLM Processing:** A green circular shape in the center, labeled "LLM" with a swirling arrow symbol inside.
3. **Randomly-Generated Responses:** A large, light-orange rectangular box containing two example responses, separated by ellipses ("..."), indicating more responses exist.
* Response 1: "In June 2007, Google introduced Android, its mobile operating system."
* Response 2: "Google launched its open-source mobile operating system Android in June 2007."
4. **Fact-Check Result:** A pink rectangular box at the bottom, containing two pieces of information:
* "Consistency Estimate: 99%"
* "Fact-Check: False" accompanied by a red "X" symbol.
5. **Arrows:** Black downward-pointing arrows indicate the flow of information between each component.
### Detailed Analysis or Content Details
The diagram shows a clear sequential flow:
1. A query ("What happened to Google in June 2007?") is input into the LLM.
2. The LLM processes the query and generates multiple responses.
3. Two example responses are provided, both stating that Google introduced/launched Android in June 2007.
4. These responses are then subjected to a fact-check, which determines them to be "False" despite a "Consistency Estimate" of 99%.
### Key Observations
The key observation is the discrepancy between the high consistency estimate (99%) and the fact-check result ("False"). This suggests that the LLM is generating responses that are internally consistent but not aligned with factual reality. The diagram emphasizes the importance of fact-checking LLM outputs, even when they appear highly confident.
### Interpretation
This diagram demonstrates a critical challenge in the development and deployment of LLMs: the potential for generating plausible-sounding but inaccurate information. The high consistency estimate indicates the LLM is confident in its response, but the fact-check reveals that this confidence is misplaced. This highlights the need for robust fact-checking mechanisms to mitigate the risk of spreading misinformation. The diagram serves as a cautionary tale, illustrating that LLMs are not inherently truthful and require external validation. The use of multiple responses suggests the LLM is exploring different phrasing, but none of them are factually correct in this instance. The diagram is a visual representation of the "hallucination" problem often encountered with LLMs.