## Bar Chart: Prediction Flip Rate Comparison for Llama Models
### Overview
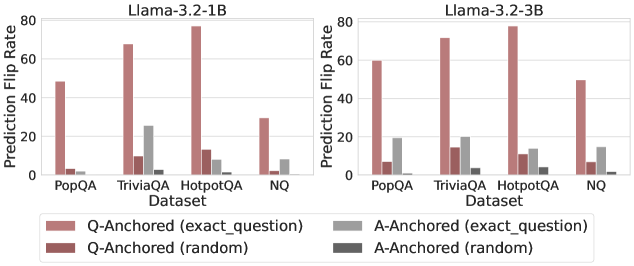
The image presents two bar charts comparing the prediction flip rates of two Llama models (Llama-3.2-1B and Llama-3.2-3B) across four datasets (PopQA, TriviaQA, HotpotQA, and NQ). The charts compare the impact of question-anchored and answer-anchored perturbations, with both exact question and random variations.
### Components/Axes
* **Titles:**
* Left Chart: Llama-3.2-1B
* Right Chart: Llama-3.2-3B
* **Y-Axis:**
* Label: Prediction Flip Rate
* Scale: 0 to 80, with tick marks at 0, 20, 40, 60, and 80.
* **X-Axis:**
* Label: Dataset
* Categories: PopQA, TriviaQA, HotpotQA, NQ
* **Legend:** Located at the bottom of the image.
* Q-Anchored (exact\_question): Light Brown
* Q-Anchored (random): Dark Brown
* A-Anchored (exact\_question): Light Gray
* A-Anchored (random): Dark Gray
### Detailed Analysis
**Llama-3.2-1B (Left Chart):**
* **PopQA:**
* Q-Anchored (exact\_question): Approximately 48
* Q-Anchored (random): Approximately 3
* A-Anchored (exact\_question): Approximately 2
* A-Anchored (random): Approximately 1
* **TriviaQA:**
* Q-Anchored (exact\_question): Approximately 68
* Q-Anchored (random): Approximately 10
* A-Anchored (exact\_question): Approximately 25
* A-Anchored (random): Approximately 3
* **HotpotQA:**
* Q-Anchored (exact\_question): Approximately 75
* Q-Anchored (random): Approximately 13
* A-Anchored (exact\_question): Approximately 8
* A-Anchored (random): Approximately 1
* **NQ:**
* Q-Anchored (exact\_question): Approximately 30
* Q-Anchored (random): Approximately 2
* A-Anchored (exact\_question): Approximately 10
* A-Anchored (random): Approximately 0.5
**Llama-3.2-3B (Right Chart):**
* **PopQA:**
* Q-Anchored (exact\_question): Approximately 60
* Q-Anchored (random): Approximately 7
* A-Anchored (exact\_question): Approximately 20
* A-Anchored (random): Approximately 2
* **TriviaQA:**
* Q-Anchored (exact\_question): Approximately 72
* Q-Anchored (random): Approximately 15
* A-Anchored (exact\_question): Approximately 20
* A-Anchored (random): Approximately 3
* **HotpotQA:**
* Q-Anchored (exact\_question): Approximately 75
* Q-Anchored (random): Approximately 10
* A-Anchored (exact\_question): Approximately 12
* A-Anchored (random): Approximately 2
* **NQ:**
* Q-Anchored (exact\_question): Approximately 50
* Q-Anchored (random): Approximately 7
* A-Anchored (exact\_question): Approximately 15
* A-Anchored (random): Approximately 1
### Key Observations
* For both models, the Q-Anchored (exact\_question) perturbation consistently results in the highest prediction flip rates across all datasets.
* Q-Anchored (random) perturbations generally have a lower impact on prediction flip rates compared to Q-Anchored (exact\_question).
* A-Anchored perturbations (both exact\_question and random) have the lowest impact on prediction flip rates.
* The HotpotQA dataset shows the highest prediction flip rates for Q-Anchored (exact\_question) in both models.
* The NQ dataset shows a relatively lower prediction flip rate for Q-Anchored (exact\_question) compared to HotpotQA and TriviaQA.
### Interpretation
The data suggests that the prediction flip rate is highly sensitive to perturbations in the question itself, especially when the exact question is used as the anchor. Random question perturbations have a lesser impact, indicating that specific question wording is crucial. Answer-anchored perturbations have the least impact, suggesting that the model is more robust to changes in the answer context. The differences in prediction flip rates across datasets may reflect the varying complexity and structure of the questions in each dataset. The Llama-3.2-3B model generally shows higher prediction flip rates compared to Llama-3.2-1B, particularly for Q-Anchored (exact\_question) perturbations, indicating that it might be more sensitive to question-based adversarial attacks.