TECHNICAL ASSET FINGERPRINT
7d195da49ef522a2e5f60dfd
Click to view fullscreen
Press ESC or click to close
FOUND IN PAPERS
EXPERT: gemma-3-27b-it-free VERSION 1
RUNTIME: google-free/gemma-3-27b-it
INTEL_VERIFIED
## Chart/Diagram Type: Experimental Setup & Correlation Function Plots
### Overview
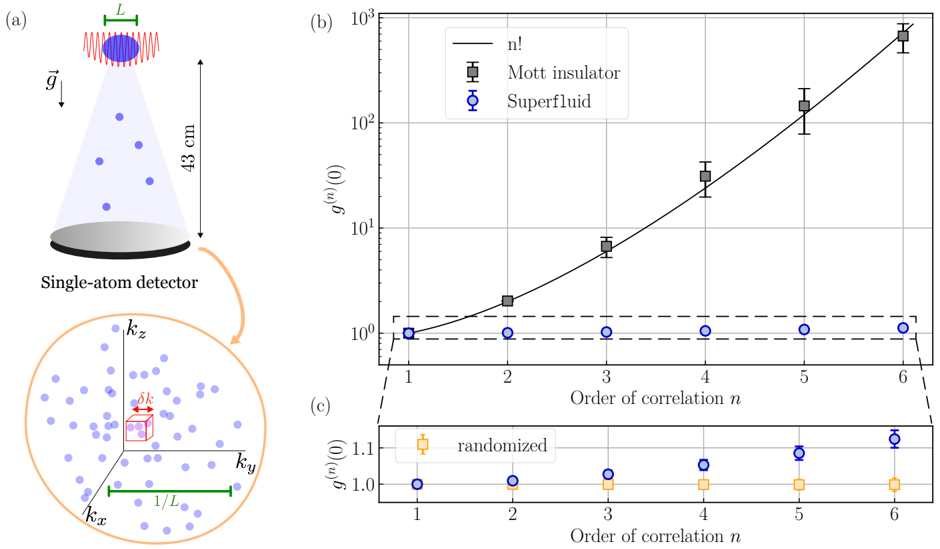
The image presents an experimental setup for observing single atoms and corresponding plots of the correlation function g<sup>(2)</sup>(0) versus the order of correlation *n* for different quantum phases of matter: Mott insulator, superfluid, and a randomized control. The setup involves a laser beam (indicated by the blue cone) focused onto a sample, and a single-atom detector.
### Components/Axes
**(a) Experimental Setup Diagram:**
* **Labels:** "L" (length scale), "g" (gravitational acceleration direction), "43 cm" (distance), "Single-atom detector".
* **Diagram Components:** Laser beam focus, atom positions, single-atom detector, k-space representation with wavevectors k<sub>x</sub>, k<sub>y</sub>, k<sub>z</sub>, and δk.
* **k-space:** A cube with dimensions 1/L.
**(b) Correlation Function Plot:**
* **X-axis:** "Order of correlation n" (scale from 1 to 6).
* **Y-axis:** "g<sup>(2)</sup>(0)" (logarithmic scale from 10<sup>0</sup> to 10<sup>3</sup>).
* **Legend:**
* Black line: "n!"
* Gray square: "Mott insulator"
* Blue circle: "Superfluid"
* **Error Bars:** Present for all data points.
**(c) Correlation Function Plot (Randomized):**
* **X-axis:** "Order of correlation n" (scale from 1 to 6).
* **Y-axis:** "g<sup>(2)</sup>(0)" (linear scale from 1.0 to 1.2).
* **Legend:**
* Red square: "randomized"
* Blue circle: "Superfluid"
* **Error Bars:** Present for all data points.
### Detailed Analysis or Content Details
**(a) Experimental Setup:**
The diagram shows a laser beam focused onto a region containing atoms. The length scale "L" is indicated on the beam. The distance from the beam focus to the single-atom detector is approximately 43 cm. The k-space representation shows the distribution of wavevectors, with a cube representing the reciprocal lattice space with dimensions 1/L.
**(b) Correlation Function Plot:**
* **n! (Black Line):** The line exhibits an exponential increase with increasing *n*.
* n=1: g<sup>(2)</sup>(0) ≈ 1.0, with error bar spanning approximately 0.8 to 1.2.
* n=2: g<sup>(2)</sup>(0) ≈ 2.0, with error bar spanning approximately 1.5 to 2.5.
* n=3: g<sup>(2)</sup>(0) ≈ 6.0, with error bar spanning approximately 4.0 to 8.0.
* n=4: g<sup>(2)</sup>(0) ≈ 24.0, with error bar spanning approximately 18.0 to 30.0.
* n=5: g<sup>(2)</sup>(0) ≈ 120.0, with error bar spanning approximately 80.0 to 160.0.
* n=6: g<sup>(2)</sup>(0) ≈ 720.0, with error bar spanning approximately 500.0 to 900.0.
* **Mott Insulator (Gray Squares):** The data points are approximately constant around g<sup>(2)</sup>(0) ≈ 1.0, with small fluctuations within the error bars.
* n=1: g<sup>(2)</sup>(0) ≈ 1.0, with error bar spanning approximately 0.8 to 1.2.
* n=2: g<sup>(2)</sup>(0) ≈ 1.2, with error bar spanning approximately 0.9 to 1.5.
* n=3: g<sup>(2)</sup>(0) ≈ 1.1, with error bar spanning approximately 0.8 to 1.4.
* n=4: g<sup>(2)</sup>(0) ≈ 1.3, with error bar spanning approximately 1.0 to 1.6.
* n=5: g<sup>(2)</sup>(0) ≈ 1.1, with error bar spanning approximately 0.9 to 1.3.
* n=6: g<sup>(2)</sup>(0) ≈ 1.2, with error bar spanning approximately 1.0 to 1.4.
* **Superfluid (Blue Circles):** The data points are approximately constant around g<sup>(2)</sup>(0) ≈ 1.0, with small fluctuations within the error bars.
* n=1: g<sup>(2)</sup>(0) ≈ 1.0, with error bar spanning approximately 0.8 to 1.2.
* n=2: g<sup>(2)</sup>(0) ≈ 1.0, with error bar spanning approximately 0.8 to 1.2.
* n=3: g<sup>(2)</sup>(0) ≈ 1.0, with error bar spanning approximately 0.8 to 1.2.
* n=4: g<sup>(2)</sup>(0) ≈ 1.0, with error bar spanning approximately 0.8 to 1.2.
* n=5: g<sup>(2)</sup>(0) ≈ 1.0, with error bar spanning approximately 0.8 to 1.2.
* n=6: g<sup>(2)</sup>(0) ≈ 1.1, with error bar spanning approximately 0.9 to 1.3.
**(c) Correlation Function Plot (Randomized):**
* **Randomized (Red Square):** The data points are approximately constant around g<sup>(2)</sup>(0) ≈ 1.1, with small fluctuations within the error bars.
* n=1: g<sup>(2)</sup>(0) ≈ 1.1, with error bar spanning approximately 0.9 to 1.3.
* n=2: g<sup>(2)</sup>(0) ≈ 1.1, with error bar spanning approximately 0.9 to 1.3.
* n=3: g<sup>(2)</sup>(0) ≈ 1.1, with error bar spanning approximately 0.9 to 1.3.
* n=4: g<sup>(2)</sup>(0) ≈ 1.1, with error bar spanning approximately 0.9 to 1.3.
* n=5: g<sup>(2)</sup>(0) ≈ 1.1, with error bar spanning approximately 0.9 to 1.3.
* n=6: g<sup>(2)</sup>(0) ≈ 1.1, with error bar spanning approximately 0.9 to 1.3.
* **Superfluid (Blue Circles):** The data points are approximately constant around g<sup>(2)</sup>(0) ≈ 1.0, with small fluctuations within the error bars.
### Key Observations
* The correlation function for the "n!" series increases dramatically with the order of correlation *n*, indicating strong correlations between atoms.
* Both the Mott insulator and superfluid phases exhibit a nearly constant correlation function around g<sup>(2)</sup>(0) ≈ 1.0, suggesting weak correlations.
* The randomized data shows a slightly elevated correlation function around g<sup>(2)</sup>(0) ≈ 1.1, indicating some residual correlations.
* The error bars are relatively large, especially for the "n!" series, indicating significant uncertainty in the measurements.
### Interpretation
The data demonstrates the distinct correlation properties of different quantum phases of matter. The exponential increase in the correlation function for the "n!" series likely represents a theoretical benchmark or a reference for comparison. The constant correlation function for the Mott insulator and superfluid phases suggests that atoms in these phases are either localized (Mott insulator) or delocalized (superfluid), resulting in weak correlations. The randomized data provides a control to assess the level of correlations present in the system due to experimental artifacts or residual interactions. The large error bars suggest that the measurements are challenging and require further refinement. The difference between the superfluid and randomized data suggests that the superfluid phase exhibits a degree of coherence not present in the randomized system. The experimental setup provides a means to probe the quantum properties of atoms and distinguish between different phases of matter based on their correlation characteristics.
DECODING INTELLIGENCE...