## Charts: Regret and Expected Mean Rewards
### Overview
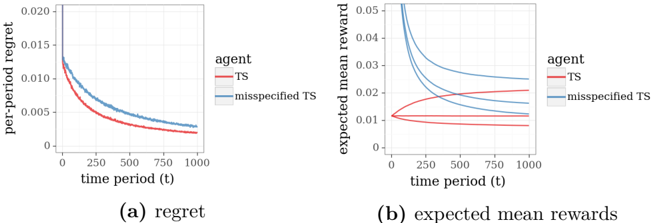
The image presents two line charts, labeled (a) "regret" and (b) "expected mean rewards". Both charts compare the performance of two agents: "TS" (Thompson Sampling) and "misspecified TS". The x-axis in both charts represents "time period (t)", ranging from 0 to 1000. The y-axis of chart (a) is "per-period regret" ranging from 0 to 0.020, while the y-axis of chart (b) is "expected mean reward" ranging from 0 to 0.05.
### Components/Axes
* **Chart (a): Regret**
* X-axis: time period (t) - Scale: 0 to 1000, with markers at 0, 250, 500, 750, and 1000.
* Y-axis: per-period regret - Scale: 0 to 0.020, with markers at 0, 0.005, 0.010, 0.015, and 0.020.
* Legend:
* "TS" - represented by a red line.
* "misspecified TS" - represented by a blue line.
* **Chart (b): Expected Mean Rewards**
* X-axis: time period (t) - Scale: 0 to 1000, with markers at 0, 250, 500, 750, and 1000.
* Y-axis: expected mean reward - Scale: 0 to 0.05, with markers at 0, 0.01, 0.02, 0.03, 0.04, and 0.05.
* Legend:
* "TS" - represented by a red line.
* "misspecified TS" - represented by a blue line.
### Detailed Analysis or Content Details
* **Chart (a): Regret**
* The "TS" line (red) starts at approximately 0.017 at t=0 and decreases rapidly to approximately 0.002 at t=1000. The line exhibits a steep negative slope initially, which gradually flattens out.
* The "misspecified TS" line (blue) starts at approximately 0.010 at t=0 and decreases more slowly than the "TS" line, reaching approximately 0.004 at t=1000. This line also exhibits a negative slope, but it is less steep than the "TS" line.
* **Chart (b): Expected Mean Rewards**
* The "TS" line (red) starts at approximately 0.012 at t=0, initially decreases to a minimum of approximately 0.008 at t=250, and then increases slightly to approximately 0.010 at t=1000.
* The "misspecified TS" line (blue) starts at approximately 0.045 at t=0 and decreases steadily to approximately 0.020 at t=1000. The line exhibits a consistent negative slope throughout the entire time period.
### Key Observations
* In the "regret" chart, "TS" consistently exhibits lower regret than "misspecified TS" across all time periods.
* In the "expected mean rewards" chart, "misspecified TS" starts with a significantly higher expected mean reward, but it decreases over time, eventually falling below the "TS" agent's reward.
* The "TS" agent's reward initially decreases and then stabilizes, suggesting a learning phase followed by consistent performance.
### Interpretation
The data suggests that while the "misspecified TS" agent may initially appear to perform better (higher expected mean reward), the "TS" agent ultimately achieves lower regret and maintains a more stable reward over time. This indicates that the "TS" agent is more efficient in learning the optimal strategy and minimizing long-term losses. The initial higher reward of the "misspecified TS" could be due to chance or a temporary advantage, but its higher regret demonstrates its sub-optimal performance in the long run. The difference in performance highlights the importance of correctly specifying the model for Thompson Sampling to achieve optimal results. The charts demonstrate a trade-off between initial reward and long-term regret, with the "TS" agent prioritizing minimizing regret, while the "misspecified TS" agent initially focuses on maximizing reward but suffers higher regret as a consequence.