## Heatmap: Model Performance Across R Values and Hops
### Overview
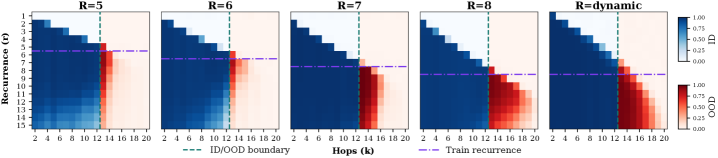
The image displays a heatmap visualization comparing model performance across different recurrence values (R) and hop counts (k). It consists of five panels labeled R=5, R=6, R=7, R=8, and R=dynamic, showing the transition between in-distribution (ID) and out-of-distribution (OOD) data regions.
### Components/Axes
- **X-axis (Hops)**: Labeled "Hops (k)" with values ranging from 2 to 20.
- **Y-axis (Recurrence)**: Labeled "Recurrence (r)" with values from 2 to 15.
- **Legend**:
- Dashed green line: "ID/OOD boundary"
- Purple dashed line: "Train recurrence"
- Color scale: Blue (ID) to Red (OOD), with a gradient from 0.00 to 1.00.
### Detailed Analysis
1. **R=5 Panel**:
- ID/OOD boundary (dashed line) at k≈12.
- Train recurrence (purple line) at r=7.
- ID region (blue) dominates left of the boundary; OOD (red) appears right of the boundary.
2. **R=6 Panel**:
- ID/OOD boundary shifts right to k≈13.
- Train recurrence remains at r=7.
- OOD region expands slightly compared to R=5.
3. **R=7 Panel**:
- ID/OOD boundary at k≈14.
- Train recurrence still at r=7.
- OOD region grows further, with red intensity increasing.
4. **R=8 Panel**:
- ID/OOD boundary at k≈15.
- Train recurrence unchanged at r=7.
- OOD region dominates the right half of the panel.
5. **R=dynamic Panel**:
- ID/OOD boundary at k≈16.
- Train recurrence persists at r=7.
- OOD region occupies the majority of the panel, with red intensity peaking.
### Key Observations
- **Boundary Shift**: The ID/OOD boundary moves rightward as R increases, indicating a gradual shift in model behavior.
- **Train Recurrence Consistency**: The purple line (r=7) remains fixed across all panels, suggesting a stable training parameter.
- **OOD Expansion**: Higher R values correlate with larger OOD regions, implying reduced model robustness to out-of-distribution data as R increases.
### Interpretation
The heatmap demonstrates that increasing R values shift the model's ID/OOD boundary toward higher hop counts, suggesting that the model's ability to distinguish in-distribution data degrades with higher R. The constant train recurrence (r=7) implies this parameter was fixed during training, while the dynamic R panel shows the most pronounced OOD dominance, highlighting potential instability in model performance under variable recurrence settings. The color gradient confirms that OOD regions (red) become more prevalent as R increases, indicating a critical trend for model evaluation under varying conditions.