## Scatter Plot: Timing vs. Guess
### Overview
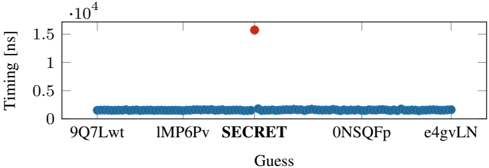
The image is a scatter plot showing the timing in nanoseconds (ns) on the y-axis versus different "Guess" values on the x-axis. Most data points are clustered near the bottom, but one data point, labeled "SECRET", has a significantly higher timing value.
### Components/Axes
* **X-axis:** "Guess" with categories: 9Q7Lwt, IMP6Pv, SECRET, 0NSQFp, e4gvLN
* **Y-axis:** "Timing [ns]" with a scale from 0 to 1.5, multiplied by 10^4.
* **Data Points:** Blue dots represent timing values for each guess, except for the "SECRET" guess, which is represented by a red dot.
### Detailed Analysis
* **X-axis Categories:** The x-axis represents different "Guess" values. The categories are:
* 9Q7Lwt
* IMP6Pv
* SECRET
* 0NSQFp
* e4gvLN
* **Y-axis Values:** The y-axis represents the timing in nanoseconds (ns), scaled by 10^4. The scale ranges from 0 to 1.5.
* **Data Point Analysis:**
* Most of the guesses (9Q7Lwt, IMP6Pv, 0NSQFp, e4gvLN) have timing values clustered around 0.2 * 10^4 ns (2000 ns).
* The "SECRET" guess has a significantly higher timing value of approximately 1.55 * 10^4 ns (15500 ns).
### Key Observations
* The "SECRET" guess has a significantly higher timing value compared to the other guesses.
* The timing values for the other guesses are relatively consistent.
### Interpretation
The scatter plot suggests that the "SECRET" guess takes significantly longer to process compared to the other guesses. This could indicate a vulnerability or a specific condition triggered by the "SECRET" input that causes a performance bottleneck. The consistent timing values for the other guesses suggest that they are processed in a similar manner. The outlier "SECRET" is a key point of interest.