\n
## Diagram: Heart Failure Diagnostic Pathway
### Overview
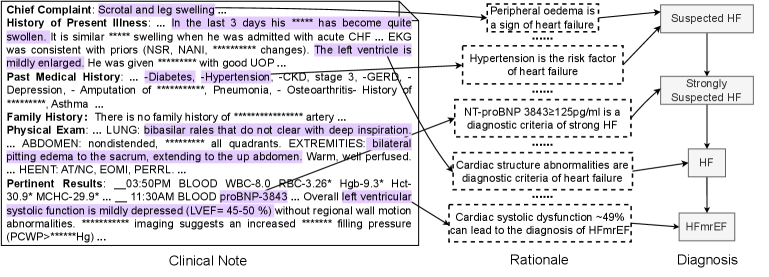
This diagram illustrates a diagnostic pathway for heart failure (HF), linking clinical notes and findings to rationale and eventual diagnosis. The diagram uses a flow chart style with arrows indicating relationships between clinical observations, underlying reasons, and diagnostic outcomes. The left side presents a clinical note with redacted information, the center provides rationale for suspicion, and the right side shows the diagnostic outcomes.
### Components/Axes
The diagram is divided into three main sections:
1. **Clinical Note:** A block of text representing patient medical information.
2. **Rationale:** A list of statements linking clinical findings to potential diagnoses.
3. **Diagnosis:** A flowchart showing the progression from suspected HF to specific HF diagnoses.
The diagram includes connecting arrows, indicating the flow of information from clinical observations to rationale and then to diagnosis.
### Detailed Analysis or Content Details
**Clinical Note (Left Side):**
The clinical note contains redacted patient information. Visible keywords include:
* **Chief Complaint:** Scrotal and leg swelling
* **History of Present Illness:** Mentions swelling over 3 days, admission with acute CHF, EKG consistent with NSR, NANI, and left ventricle enlargement.
* **Past Medical History:** Diabetes, Hypertension, CKD stage 3, GERD, Depression, Amputation, Pneumonia, Osteoarthritis, History of Asthma.
* **Family History:** No family history of artery disease.
* **Physical Exam:** Lung findings (bibasilar rales), abdominal findings, pitting edema, HEENT, AT/NC, EOMI, PERRL.
* **Pertinent Results:** 03:50PM BLOOD WBC-8.0 RBC-3.26 Hgb-9.3 Hct-30.9 MCHC-29.9, 11:30AM Blood proBNP-3843, Overall left ventricular systolic function is mildly depressed (LVEF= 45-50%), imaging suggests increased filling pressure (PCWP=***Hg).
**Rationale (Center):**
* Peripheral edema is a sign of heart failure.
* Hypertension is the risk factor for heart failure.
* NT-proBNP 3843±125pg/ml is a diagnostic criteria of strong HF.
* Cardiac structure abnormalities are diagnostic criteria of heart failure.
* Cardiac systolic dysfunction <49% can lead to the diagnosis of HFmEF.
**Diagnosis (Right Side):**
* **Suspected HF** (Top box) - connected to Peripheral edema and Hypertension.
* **Strongly Suspected HF** (Middle box) - connected to NT-proBNP and Cardiac structure abnormalities.
* **HF** (Central box) - connected to Strongly Suspected HF.
* **HFmEF** (Bottom box) - connected to HF and Cardiac systolic dysfunction.
### Key Observations
* The diagram highlights a clear pathway from clinical presentation (edema, hypertension) to biochemical markers (NT-proBNP) and imaging findings (LVEF, PCWP) leading to a diagnosis of heart failure.
* The use of "±" in the NT-proBNP value suggests a range or uncertainty in the measurement.
* The diagram suggests that a combination of clinical findings and diagnostic tests is necessary to arrive at a diagnosis.
* The diagram focuses on HFmEF (Heart Failure with mildly reduced Ejection Fraction) as a potential outcome.
### Interpretation
This diagram represents a simplified clinical decision-making process for heart failure. It demonstrates how a physician might integrate information from a patient's history, physical exam, and laboratory/imaging results to arrive at a diagnosis. The diagram emphasizes the importance of considering multiple factors, rather than relying on a single test or finding. The flow from clinical note to rationale to diagnosis suggests a Bayesian approach to diagnosis, where initial observations inform probabilities that are updated with further evidence. The diagram's focus on HFmEF reflects the increasing recognition of this subtype of heart failure, which often presents with subtle symptoms and can be challenging to diagnose. The redacted information in the clinical note suggests that this diagram is intended as a general illustration of the diagnostic process, rather than a specific case study.