TECHNICAL ASSET FINGERPRINT
7d99b7a671d3022e28249266
Click to view fullscreen
Press ESC or click to close
FOUND IN PAPERS
EXPERT: gemini-2.0-flash VERSION 1
RUNTIME: nugit/gemini/gemini-2.0-flash
INTEL_VERIFIED
## Scatter Plot: LLM Performance Across Datasets
### Overview
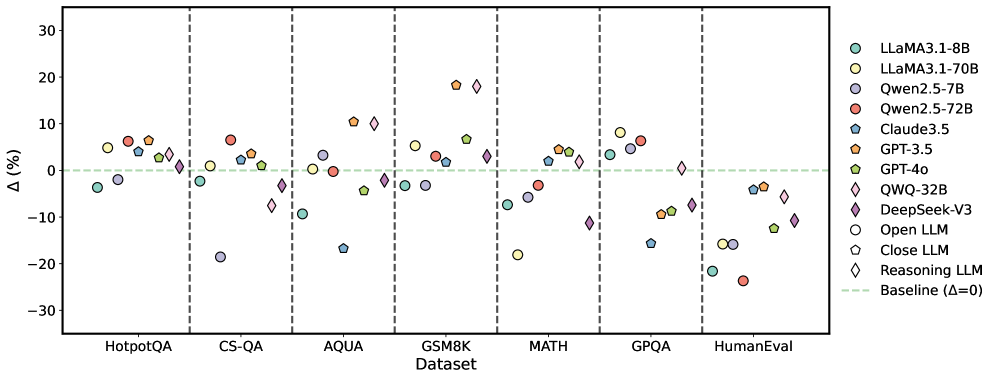
The image is a scatter plot comparing the performance of various Large Language Models (LLMs) across different datasets. The y-axis represents the percentage difference (Δ (%)), and the x-axis represents the datasets. Each LLM is represented by a unique color and marker. A horizontal dashed line indicates the baseline performance (Δ = 0).
### Components/Axes
* **X-axis:** "Dataset" with categories: HotpotQA, CS-QA, AQUA, GSM8K, MATH, GPQA, HumanEval. Vertical dashed lines separate the datasets.
* **Y-axis:** "Δ (%)" ranging from -30 to 30, with tick marks at -30, -20, -10, 0, 10, 20, and 30.
* **Legend (Top-Right):**
* Light Blue Circle: LLaMA3.1-8B
* Yellow Circle: LLaMA3.1-70B
* Purple Circle: Qwen2.5-7B
* Red Circle: Qwen2.5-72B
* Dark Blue Pentagon: Claude3.5
* Orange Pentagon: GPT-3.5
* Green Pentagon: GPT-4o
* Light Blue Diamond: QWQ-32B
* Purple Diamond: DeepSeek-V3
* White Circle: Open LLM
* Gray Pentagon: Close LLM
* White Diamond: Reasoning LLM
* Light Green Dashed Line: Baseline (Δ=0)
### Detailed Analysis
**HotpotQA Dataset:**
* LLaMA3.1-8B (Light Blue Circle): Approximately -4%
* LLaMA3.1-70B (Yellow Circle): Approximately 4%
* Qwen2.5-7B (Purple Circle): Approximately -3%
* Qwen2.5-72B (Red Circle): Approximately 6%
* Claude3.5 (Dark Blue Pentagon): Approximately 4%
* GPT-3.5 (Orange Pentagon): Approximately 5%
* GPT-4o (Green Pentagon): Approximately 3%
* QWQ-32B (Light Blue Diamond): Approximately 3%
* DeepSeek-V3 (Purple Diamond): Approximately 2%
* Open LLM (White Circle): Approximately 1%
* Close LLM (Gray Pentagon): Approximately 2%
* Reasoning LLM (White Diamond): Approximately 3%
**CS-QA Dataset:**
* LLaMA3.1-8B (Light Blue Circle): Approximately -2%
* LLaMA3.1-70B (Yellow Circle): Approximately 8%
* Qwen2.5-7B (Purple Circle): Approximately -1%
* Qwen2.5-72B (Red Circle): Approximately 9%
* Claude3.5 (Dark Blue Pentagon): Approximately 7%
* GPT-3.5 (Orange Pentagon): Approximately 6%
* GPT-4o (Green Pentagon): Approximately 5%
* QWQ-32B (Light Blue Diamond): Approximately 1%
* DeepSeek-V3 (Purple Diamond): Approximately 1%
* Open LLM (White Circle): Approximately -18%
* Close LLM (Gray Pentagon): Approximately 1%
* Reasoning LLM (White Diamond): Approximately 1%
**AQUA Dataset:**
* LLaMA3.1-8B (Light Blue Circle): Approximately -1%
* LLaMA3.1-70B (Yellow Circle): Approximately 4%
* Qwen2.5-7B (Purple Circle): Approximately -1%
* Qwen2.5-72B (Red Circle): Approximately 7%
* Claude3.5 (Dark Blue Pentagon): Approximately -17%
* GPT-3.5 (Orange Pentagon): Approximately 5%
* GPT-4o (Green Pentagon): Approximately 2%
* QWQ-32B (Light Blue Diamond): Approximately 3%
* DeepSeek-V3 (Purple Diamond): Approximately 1%
* Open LLM (White Circle): Approximately -1%
* Close LLM (Gray Pentagon): Approximately 1%
* Reasoning LLM (White Diamond): Approximately 3%
**GSM8K Dataset:**
* LLaMA3.1-8B (Light Blue Circle): Approximately -2%
* LLaMA3.1-70B (Yellow Circle): Approximately 18%
* Qwen2.5-7B (Purple Circle): Approximately 3%
* Qwen2.5-72B (Red Circle): Approximately 7%
* Claude3.5 (Dark Blue Pentagon): Approximately 3%
* GPT-3.5 (Orange Pentagon): Approximately 18%
* GPT-4o (Green Pentagon): Approximately 2%
* QWQ-32B (Light Blue Diamond): Approximately 1%
* DeepSeek-V3 (Purple Diamond): Approximately 2%
* Open LLM (White Circle): Approximately -2%
* Close LLM (Gray Pentagon): Approximately 2%
* Reasoning LLM (White Diamond): Approximately 2%
**MATH Dataset:**
* LLaMA3.1-8B (Light Blue Circle): Approximately -1%
* LLaMA3.1-70B (Yellow Circle): Approximately 4%
* Qwen2.5-7B (Purple Circle): Approximately 2%
* Qwen2.5-72B (Red Circle): Approximately 4%
* Claude3.5 (Dark Blue Pentagon): Approximately 3%
* GPT-3.5 (Orange Pentagon): Approximately 5%
* GPT-4o (Green Pentagon): Approximately 2%
* QWQ-32B (Light Blue Diamond): Approximately 2%
* DeepSeek-V3 (Purple Diamond): Approximately 2%
* Open LLM (White Circle): Approximately -16%
* Close LLM (Gray Pentagon): Approximately 2%
* Reasoning LLM (White Diamond): Approximately 2%
**GPQA Dataset:**
* LLaMA3.1-8B (Light Blue Circle): Approximately -10%
* LLaMA3.1-70B (Yellow Circle): Approximately -8%
* Qwen2.5-7B (Purple Circle): Approximately -9%
* Qwen2.5-72B (Red Circle): Approximately 5%
* Claude3.5 (Dark Blue Pentagon): Approximately -15%
* GPT-3.5 (Orange Pentagon): Approximately 4%
* GPT-4o (Green Pentagon): Approximately 3%
* QWQ-32B (Light Blue Diamond): Approximately 3%
* DeepSeek-V3 (Purple Diamond): Approximately 3%
* Open LLM (White Circle): Approximately -9%
* Close LLM (Gray Pentagon): Approximately 3%
* Reasoning LLM (White Diamond): Approximately 3%
**HumanEval Dataset:**
* LLaMA3.1-8B (Light Blue Circle): Approximately -23%
* LLaMA3.1-70B (Yellow Circle): Approximately -19%
* Qwen2.5-7B (Purple Circle): Approximately -15%
* Qwen2.5-72B (Red Circle): Approximately 8%
* Claude3.5 (Dark Blue Pentagon): Approximately -22%
* GPT-3.5 (Orange Pentagon): Approximately 5%
* GPT-4o (Green Pentagon): Approximately 3%
* QWQ-32B (Light Blue Diamond): Approximately -5%
* DeepSeek-V3 (Purple Diamond): Approximately -4%
* Open LLM (White Circle): Approximately -24%
* Close LLM (Gray Pentagon): Approximately -5%
* Reasoning LLM (White Diamond): Approximately -5%
### Key Observations
* The performance of different LLMs varies significantly across datasets.
* Some models consistently outperform others across all datasets (e.g., GPT-3.5, GPT-4o).
* Open LLM shows particularly poor performance on CS-QA, MATH, and HumanEval datasets.
* Claude3.5 shows particularly poor performance on AQUA, GPQA, and HumanEval datasets.
* LLaMA3.1-8B shows particularly poor performance on HumanEval datasets.
### Interpretation
The scatter plot provides a comparative analysis of LLM performance on various tasks represented by the datasets. The percentage difference (Δ (%)) likely indicates the improvement or decline in performance relative to a baseline or a specific metric. The data suggests that no single LLM excels in all tasks, highlighting the importance of task-specific model selection. The significant performance variations across datasets indicate that the models have different strengths and weaknesses, possibly due to their training data or architecture. The negative values suggest that some models perform worse than the baseline on certain tasks. The plot is useful for identifying which models are best suited for specific applications based on their performance on relevant datasets. The performance of Open LLM is a notable outlier, suggesting potential issues with its training or architecture.
DECODING INTELLIGENCE...