## Flowchart: Probability Problem Decomposition
### Overview
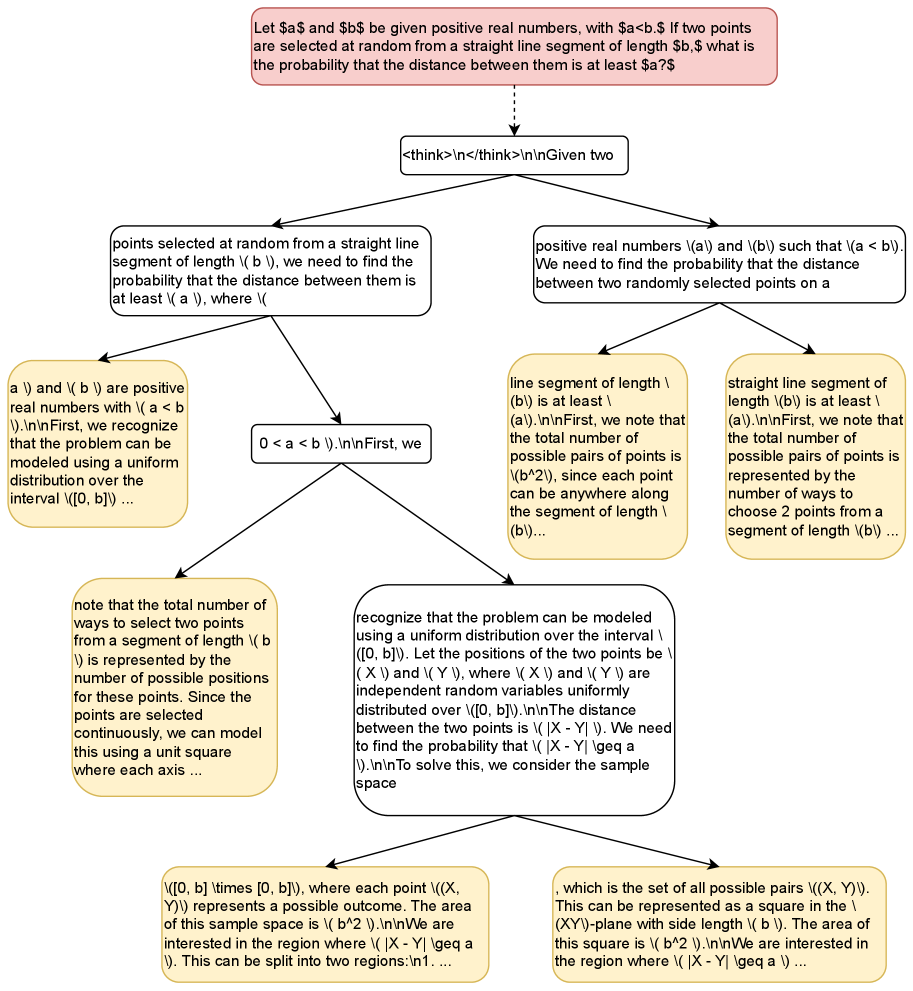
The image is a flowchart outlining the decomposition of a probability problem. It starts with a general problem statement and branches into different approaches and considerations for solving it. The flowchart uses text boxes connected by arrows to represent the flow of logic and problem-solving steps.
### Components/Axes
* **Nodes:** Rectangular boxes with rounded corners containing text.
* **Edges:** Arrows indicating the flow of thought or steps.
* **Root Node (Top):** Contains the initial problem statement.
* **Intermediate Nodes:** Represent different perspectives or sub-problems.
* **Leaf Nodes (Bottom):** Represent specific approaches or considerations.
### Detailed Analysis
1. **Root Node (Top, Red):**
* Text: "Let $a$ and $b$ be given positive real numbers, with $a<b.$ If two points are selected at random from a straight line segment of length $b,$ what is the probability that the distance between them is at least $a?$".
* Color: Red.
* Shape: Rounded rectangle.
2. **Second Node (Center, White):**
* Text: "<think>\n</think>\n\nGiven two"
* Color: White.
* Shape: Rounded rectangle.
* Position: Directly below the root node, connected by a dashed arrow.
3. **Third Node (Left Branch, White):**
* Text: "points selected at random from a straight line segment of length \(b \), we need to find the probability that the distance between them is at least (a ), where \("
* Color: White.
* Shape: Rounded rectangle.
* Position: Below and to the left of the second node.
4. **Third Node (Right Branch, White):**
* Text: "positive real numbers \(a\) and \(b\) such that \(a < b\). We need to find the probability that the distance between two randomly selected points on a"
* Color: White.
* Shape: Rounded rectangle.
* Position: Below and to the right of the second node.
5. **Fourth Node (Left-Left Branch, Yellow):**
* Text: "a \) and \(b) are positive real numbers with \(a < b \).\n\nFirst, we recognize that the problem can be modeled using a uniform distribution over the interval \([0, b]) ..."
* Color: Yellow.
* Shape: Rounded rectangle.
* Position: Below and to the left of the third node (left branch).
6. **Fourth Node (Left-Right Branch, Yellow):**
* Text: "0 < a < b \).\n\nFirst, we"
* Color: Yellow.
* Shape: Rounded rectangle.
* Position: Below and to the right of the third node (left branch).
7. **Fourth Node (Right-Left Branch, Yellow):**
* Text: "line segment of length \ (b\) is at least \ (a\).\n\nFirst, we note that the total number of possible pairs of points is \(b^2\), since each point can be anywhere along the segment of length \ (bl)..."
* Color: Yellow.
* Shape: Rounded rectangle.
* Position: Below and to the left of the third node (right branch).
8. **Fourth Node (Right-Right Branch, Yellow):**
* Text: "straight line segment of length \(b\) is at least \ (a\).\n\nFirst, we note that the total number of possible pairs of points is represented by the number of ways to choose 2 points from a segment of length \(b\)"
* Color: Yellow.
* Shape: Rounded rectangle.
* Position: Below and to the right of the third node (right branch).
9. **Fifth Node (Left-Left-Down Branch, Yellow):**
* Text: "note that the total number of ways to select two points from a segment of length \(b \) is represented by the number of possible positions for these points. Since the points are selected continuously, we can model this using a unit square where each axis ..."
* Color: Yellow.
* Shape: Rounded rectangle.
* Position: Below the fourth node (left-left branch).
10. **Fifth Node (Right-Left-Down Branch, Yellow):**
* Text: "recognize that the problem can be modeled using a uniform distribution over the interval \ ([0, b]\). Let the positions of the two points be (X) and \(YI), where \(X \) and \(Y \) are independent random variables uniformly distributed over \([0, b]\).\n\nThe distance between the two points is \(IX - Y 1). We need to find the probability that \(IX - Y \geq a \).\n\nTo solve this, we consider the sample space"
* Color: Yellow.
* Shape: Rounded rectangle.
* Position: Below the fourth node (right-left branch).
11. **Sixth Node (Left-Left-Down-Down Branch, Yellow):**
* Text: "\([0, b] \times [0, b]\), where each point \((X, Y)\) represents a possible outcome. The area of this sample space is \(b^2 \).\n\nWe are interested in the region where \(IX - Y \geq a 1). This can be split into two regions:\n1...."
* Color: Yellow.
* Shape: Rounded rectangle.
* Position: Below the fifth node (left-left-down branch).
12. **Sixth Node (Right-Left-Down-Down Branch, Yellow):**
* Text: ", which is the set of all possible pairs \((X, Y)\). This can be represented as a square in the \ (XY)-plane with side length \(b \). The area of this square is \(b^2 \).\n\nWe are interested in the region where \(X - Y \geq a \) ..."
* Color: Yellow.
* Shape: Rounded rectangle.
* Position: Below the fifth node (right-left-down branch).
### Key Observations
* The flowchart starts with a general probability problem and breaks it down into smaller, more manageable sub-problems.
* Different approaches to modeling the problem are explored, including using uniform distributions and considering the sample space.
* The flowchart highlights the importance of recognizing the constraints and conditions of the problem (e.g., 0 < a < b).
### Interpretation
The flowchart represents a structured approach to solving a probability problem. It demonstrates how a complex problem can be broken down into smaller, more manageable parts. The different branches represent alternative ways of thinking about the problem and highlight the key considerations for finding a solution. The use of uniform distributions and sample spaces suggests a quantitative approach to solving the problem. The flowchart is a visual representation of the problem-solving process, guiding the user through the steps needed to arrive at a solution.