## Diagram: SymDQN Process
### Overview
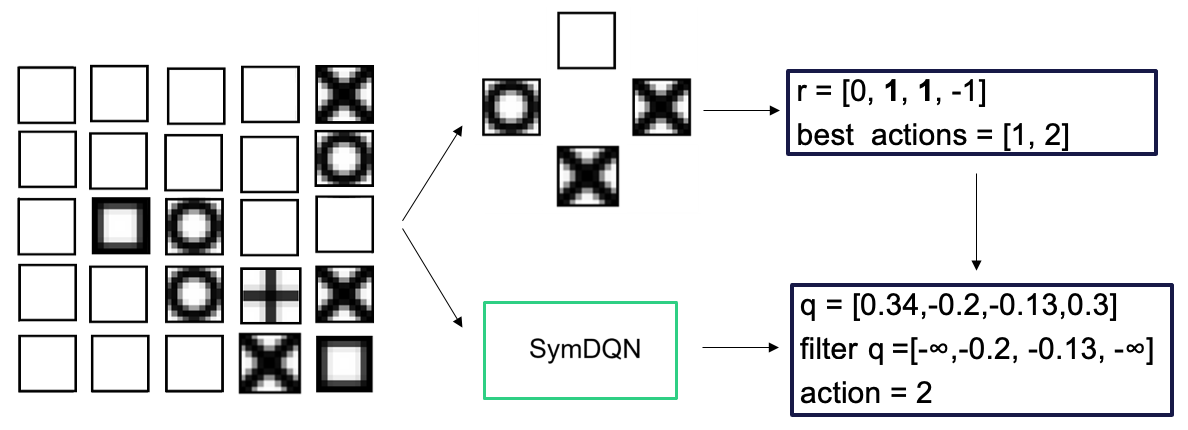
The image illustrates a process involving a 4x5 grid of states, a selection of possible actions, and the application of a SymDQN (Symmetric Deep Q-Network) to determine the best action. The diagram shows the flow of information from the initial state representation to the final action selection.
### Components/Axes
* **Left Side:** A 4x5 grid representing the game states. Each cell contains a different pattern, including empty squares, squares with a filled center, circles, crosses, and X-shaped patterns.
* **Center:** A set of five possible actions arranged in a cross shape. The actions are represented by different patterns within squares: empty, circle, and cross.
* **SymDQN Block:** A green rectangle labeled "SymDQN" in the center of the diagram.
* **Top-Right Box:** A blue rectangle containing the reward values and best actions:
* `r = [0, 1, 1, -1]`
* `best actions = [1, 2]`
* **Bottom-Right Box:** A blue rectangle containing the Q-values, filtered Q-values, and the selected action:
* `q = [0.34, -0.2, -0.13, 0.3]`
* `filter q = [-∞, -0.2, -0.13, -∞]`
* `action = 2`
* **Arrows:** Arrows indicate the flow of information from the grid to the actions, from the actions to the SymDQN, and from the SymDQN to the top-right and bottom-right boxes.
### Detailed Analysis
1. **Grid of States:** The 4x5 grid on the left shows various states. The patterns in the grid cells are as follows (reading left to right, top to bottom):
* Row 1: Empty, Empty, Empty, Empty, Empty
* Row 2: Empty, Empty, Empty, Circle, Cross
* Row 3: Empty, Empty, Square, Circle, Empty
* Row 4: Empty, Circle, Plus, Cross, Square
2. **Possible Actions:** The five possible actions are arranged in a cross shape. The top action is an empty square, the left action is a circle, the right action is a cross, and the bottom action is a cross.
3. **SymDQN Processing:** The SymDQN block represents the application of a symmetric deep Q-network to the selected actions.
4. **Reward and Best Actions:** The top-right box shows the reward values `r = [0, 1, 1, -1]` and the best actions `best actions = [1, 2]`.
5. **Q-Values and Action Selection:** The bottom-right box shows the Q-values `q = [0.34, -0.2, -0.13, 0.3]`. The filtered Q-values are `filter q = [-∞, -0.2, -0.13, -∞]`. The selected action is `action = 2`.
### Key Observations
* The SymDQN takes the possible actions and the grid state as input.
* The SymDQN outputs Q-values for each action.
* The Q-values are filtered, likely to remove invalid or impossible actions (represented by -∞).
* The action with the highest filtered Q-value is selected (action = 2).
### Interpretation
The diagram illustrates a reinforcement learning process using a SymDQN. The agent observes a state (represented by the grid), considers possible actions, and uses the SymDQN to estimate the Q-values for each action. The Q-values are then filtered to remove invalid actions, and the action with the highest filtered Q-value is selected. The reward values and best actions provide feedback to the agent, allowing it to learn and improve its policy over time. The use of a SymDQN suggests that the environment has some form of symmetry that can be exploited to improve learning efficiency.