## Line Chart: Exact Match vs. Data Percentage
### Overview
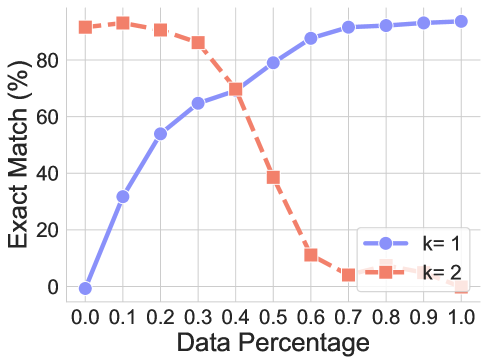
The image presents a line chart illustrating the relationship between "Data Percentage" (x-axis) and "Exact Match" (y-axis) for two different values of 'k' (k=1 and k=2). The chart shows how the percentage of exact matches changes as the amount of data used increases.
### Components/Axes
* **X-axis:** "Data Percentage", ranging from 0.0 to 1.0, with increments of 0.1.
* **Y-axis:** "Exact Match (%)", ranging from 0 to 100, with increments of 20.
* **Lines:** Two lines are plotted:
* Blue line with circular markers, labeled "k = 1"
* Red line with square markers, labeled "k = 2"
* **Legend:** Located in the bottom-right corner, identifying the lines and their corresponding 'k' values.
### Detailed Analysis
**Line k = 1 (Blue):**
The blue line starts at approximately (0.0, 0) and exhibits a steep upward trend until around (0.4, 65). It continues to rise, but at a decreasing rate, reaching approximately (0.8, 92) and leveling off to approximately (1.0, 94).
* (0.0, 0)
* (0.1, 40)
* (0.2, 60)
* (0.3, 67)
* (0.4, 70)
* (0.5, 78)
* (0.6, 85)
* (0.7, 89)
* (0.8, 92)
* (0.9, 93)
* (1.0, 94)
**Line k = 2 (Red):**
The red line begins at approximately (0.0, 88) and remains relatively stable until around (0.4, 85). It then experiences a rapid decline, dropping to approximately (0.6, 40) and continuing to decrease to approximately (0.7, 10). It reaches approximately (0.8, 5) and (1.0, 2).
* (0.0, 88)
* (0.1, 88)
* (0.2, 85)
* (0.3, 82)
* (0.4, 75)
* (0.5, 45)
* (0.6, 40)
* (0.7, 10)
* (0.8, 5)
* (0.9, 3)
* (1.0, 2)
### Key Observations
* The "k = 1" line consistently shows a positive correlation between data percentage and exact match, increasing as more data is used.
* The "k = 2" line initially has a high exact match but rapidly decreases as data percentage increases.
* The lines intersect around the data percentage of 0.4, where the exact match is approximately 70% for k=1 and 75% for k=2.
* The "k = 2" line demonstrates a significant drop in exact match with increasing data percentage, suggesting a potential overfitting or instability issue.
### Interpretation
The chart likely represents the performance of a model or algorithm with two different parameter settings (k=1 and k=2) as the amount of training data increases. The "Exact Match" metric indicates the accuracy of the model's predictions.
The results suggest that:
* For smaller datasets, the model with k=2 performs slightly better than the model with k=1.
* As the dataset grows, the model with k=1 becomes more accurate and stable, while the model with k=2 suffers a dramatic decrease in accuracy. This could indicate that k=2 is more sensitive to noise or outliers in the data, leading to overfitting.
* The optimal value of 'k' appears to be 1, as it provides a more consistent and reliable performance across different data sizes.
The chart highlights the importance of choosing appropriate model parameters and considering the impact of data size on model performance. The rapid decline of the k=2 line suggests that increasing the complexity of the model (potentially through a higher 'k' value) does not always lead to better results, especially with larger datasets.