\n
## Diagram: Astronomical Observations & Notes
### Overview
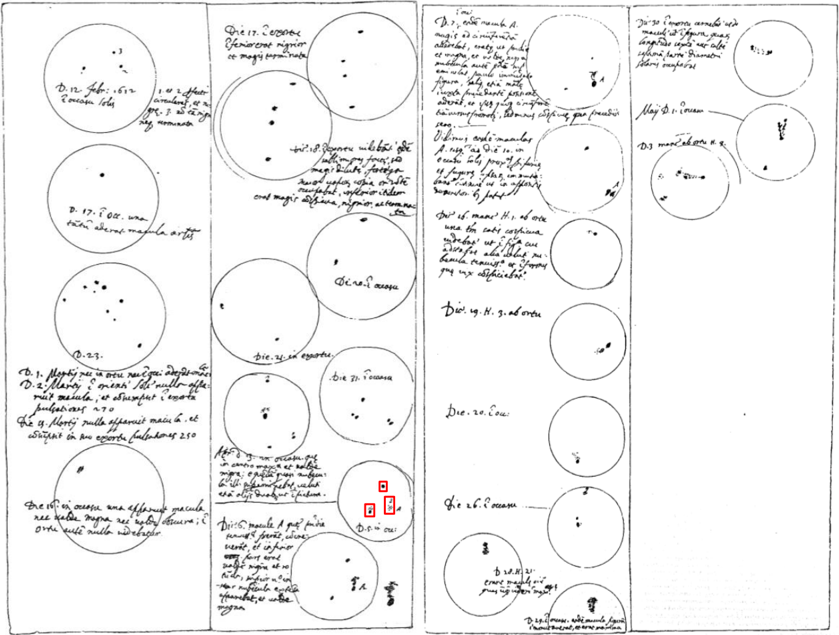
The image presents a hand-drawn diagram resembling a series of astronomical observations or sketches, arranged in a grid-like pattern. Each cell contains circular representations, likely depicting celestial bodies or fields of view, accompanied by handwritten notes in Latin. The overall impression is that of a scientific record from a historical period, possibly related to early astronomy or astrology.
### Components/Axes
The diagram is organized into a 3x4 grid of cells. Each cell contains:
* **Circular Representation:** A large circle, potentially representing a field of view or the outline of a celestial object. Within these circles are smaller dots representing stars or other points of interest.
* **Handwritten Notes:** Extensive notes written in Latin, surrounding or within the circles. These notes appear to describe the observations, including dates, positions, and possibly interpretations.
* **Date/Time Indicators:** Dates and times are frequently mentioned within the notes, such as "Die 17. Decembr." (December 17th) and "Die 9. Martii" (March 9th).
* **Red Square:** One cell contains a small red square with additional markings.
### Detailed Analysis / Content Details
Due to the handwriting and age of the document, precise transcription is difficult. Here's a breakdown of the content, cell by cell, with approximate interpretations:
**Row 1:**
* **Cell 1 (Top-Left):** "Die 17. Decembr." followed by notes about "stella" (star) and "nova" (new star). Mentions "in capite" (in the head).
* **Cell 2:** "Die 17. Decembr." with notes about "stella nigrior" (darker star) and "in media regione" (in the middle region).
* **Cell 3:** Extensive notes in Latin, discussing observations and possibly interpretations. Mentions "nova stella" and "in regione" (in the region).
* **Cell 4:** "Martij die 9. hora 1." (March 9th, hour 1) with notes about a "stella" and its position.
**Row 2:**
* **Cell 5:** "Die 17. Decembr." with notes about a "nova stella" and "sub dracone" (under the dragon - a constellation).
* **Cell 6:** "Die 16. Decembr." with notes about a "nova stella" and its position.
* **Cell 7:** "Die 16. Decembr." with notes about a "nova stella" and its position.
* **Cell 8:** "Die 9. Martii." with notes about a "nova stella" and its position.
**Row 3:**
* **Cell 9:** "Die 9. Martii." with notes about "stella" and its position. Mentions "in regione" (in the region).
* **Cell 10:** "Die 16. Martii." with notes about a "nova stella" and its position.
* **Cell 11:** Contains a red square with markings. Notes mention "nova stella" and "in regione" (in the region).
* **Cell 12:** "Die 20. Martii." with notes about a "nova stella" and its position.
**Additional Notes:**
* The notes frequently refer to "nova stella" (new star), suggesting the observations relate to a supernova or a newly discovered celestial object.
* References to constellations like "draco" (dragon) are present.
* The notes include descriptions of the stars' brightness and color ("nigrior" - darker).
* The handwriting is cursive and difficult to decipher completely.
### Key Observations
* The diagram focuses on observations of "nova stella" (new stars) across a period of time in December and March.
* The notes are detailed and attempt to pinpoint the position of these stars within specific regions of the sky.
* The use of Latin suggests a historical context, likely pre-modern astronomy.
* The red square in Cell 11 might indicate a particularly significant observation or a point of interest.
### Interpretation
This diagram appears to be a record of observations made by an astronomer (or astrologer) in the 17th or 18th century, documenting the appearance of a new star (likely a supernova). The meticulous notes and attempts to locate the star within constellations demonstrate a scientific approach to observation, even if influenced by the astrological beliefs of the time. The repeated mention of "nova stella" suggests a significant astronomical event that captured the observer's attention. The grid format and consistent notation indicate a systematic approach to data collection. The diagram provides a valuable glimpse into the practices of early astronomy and the methods used to record and interpret celestial phenomena. The red square could signify a particularly bright or noteworthy observation, perhaps marking a turning point in the observer's understanding of the event. The notes are not merely descriptive; they attempt to contextualize the observations within a broader cosmological framework.