## Stacked Histogram: Confidence vs. Count of Correct/Wrong Answers
### Overview
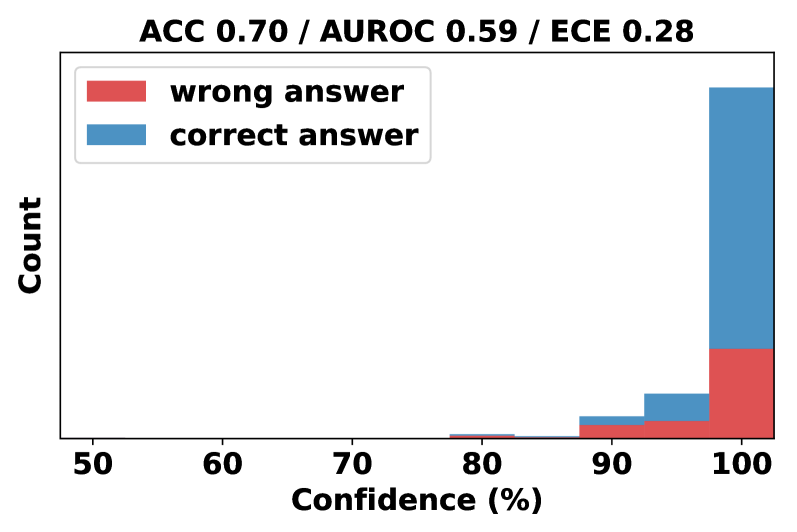
The image is a stacked histogram showing the distribution of confidence levels for correct and wrong answers. The x-axis represents confidence levels in percentage, and the y-axis represents the count. The histogram is stacked, with the count of wrong answers shown in red and the count of correct answers shown in blue. The title provides the accuracy (ACC), Area Under the Receiver Operating Characteristic Curve (AUROC), and Expected Calibration Error (ECE) values.
### Components/Axes
* **Title:** ACC 0.70 / AUROC 0.59 / ECE 0.28
* **X-axis:** Confidence (%) with markers at 50, 60, 70, 80, 90, and 100.
* **Y-axis:** Count (no specific numerical markers are provided, only the label).
* **Legend:** Located in the top-left corner.
* Red: wrong answer
* Blue: correct answer
### Detailed Analysis
The histogram shows the distribution of confidence levels for correct and wrong answers.
* **Confidence 50-60%:** No data present.
* **Confidence 60-70%:** No data present.
* **Confidence 70-80%:** A very small red bar (wrong answer) is visible. The count is approximately 0-5.
* **Confidence 80-90%:** A small red bar (wrong answer) is visible. The count is approximately 0-5.
* **Confidence 90-100%:** A red bar (wrong answer) and a blue bar (correct answer) are stacked. The red bar's count is approximately 5-10, and the blue bar's count is approximately 5-10.
* **Confidence 100%:** A red bar (wrong answer) and a blue bar (correct answer) are stacked. The red bar's count is approximately 10-15, and the blue bar's count is approximately 40-50.
**Trend Verification:**
* **Correct Answers (Blue):** The count of correct answers increases significantly as confidence increases, with the highest count at 100% confidence.
* **Wrong Answers (Red):** The count of wrong answers is low across all confidence levels, with a slight increase at 100% confidence.
### Key Observations
* The vast majority of answers with high confidence (100%) are correct.
* There are very few answers with low confidence (below 90%).
* The model appears to be well-calibrated, as high confidence generally corresponds to correct answers.
* The model has an accuracy of 70%, an AUROC of 0.59, and an ECE of 0.28.
### Interpretation
The stacked histogram illustrates the relationship between the model's confidence and the correctness of its answers. The concentration of correct answers at high confidence levels suggests that the model is generally reliable in its predictions. However, the presence of wrong answers at high confidence indicates some degree of overconfidence or miscalibration. The ACC, AUROC, and ECE values provide a quantitative assessment of the model's performance, with the ECE value indicating the calibration error. A lower ECE value generally indicates better calibration. The AUROC value of 0.59 indicates that the model's ability to discriminate between positive and negative classes is slightly better than random guessing.