TECHNICAL ASSET FINGERPRINT
7e71043593779602a4dc3ae5
Click to view fullscreen
Press ESC or click to close
FOUND IN PAPERS
EXPERT: healer-alpha-free VERSION 1
RUNTIME: free/openrouter/healer-alpha
INTEL_VERIFIED
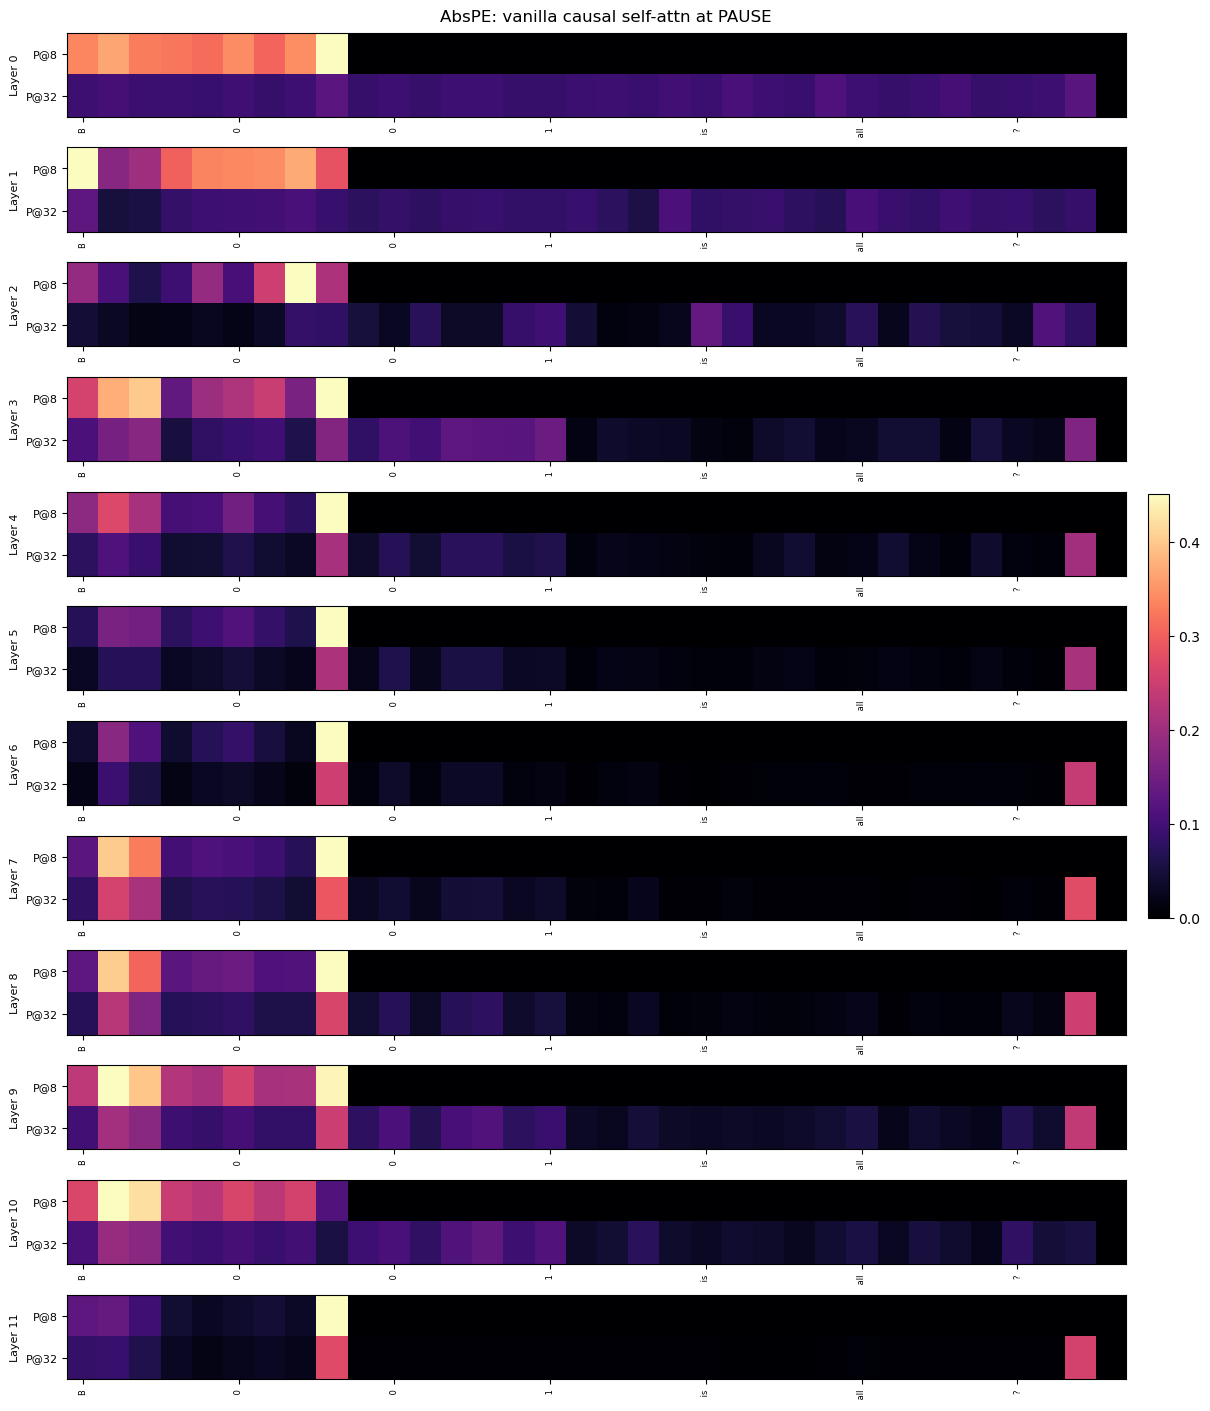
## Heatmap: AbsPE: vanilla causal self-attn at PAUSE
### Overview
This image is a vertical stack of 12 horizontal heatmaps, each representing a different layer (Layer 0 to Layer 11) of a neural network model. The visualization appears to analyze attention patterns or activation values at a specific token or position labeled "PAUSE" within a "vanilla causal self-attention" mechanism using "AbsPE" (likely Absolute Positional Encoding). Each layer's heatmap is subdivided into two rows, labeled "P@8" and "P@32", which likely represent two different positional contexts or sequence lengths (e.g., attention at position 8 vs. position 32). A color bar on the right provides the scale for the heatmap values.
### Components/Axes
* **Title:** "AbsPE: vanilla causal self-attn at PAUSE" (centered at the top).
* **Vertical Axis (Left Side):** Labels for each of the 12 layers, from "Layer 0" (top) to "Layer 11" (bottom).
* **Sub-Row Labels (Within each layer):** Each layer's heatmap contains two rows. The top row is labeled "P@8" and the bottom row is labeled "P@32". These labels are positioned to the left of their respective rows.
* **Horizontal Axis (Bottom of each heatmap):** A set of seven numerical labels appears below each individual heatmap. The sequence is consistent across all layers: `8`, `0`, `0`, `1`, `15`, `16`, `7`. These likely represent specific token indices or positions in a sequence.
* **Color Bar (Right Side):** A vertical gradient bar mapping colors to numerical values. The scale runs from `0.0` (bottom, dark purple/black) to `0.4` (top, bright yellow). Intermediate ticks are at `0.1`, `0.2`, and `0.3`.
* **Heatmap Grid:** Each of the 12 layers contains a grid of colored cells. The grid appears to have 7 columns (corresponding to the x-axis labels) and 2 rows (P@8 and P@32).
### Detailed Analysis
**Trend Verification & Data Point Extraction:**
The heatmaps show the distribution of values (likely attention weights or activation strengths) across 7 positions (x-axis) for two conditions (P@8, P@32) across 12 network layers.
* **General Pattern (P@8 vs. P@32):** Across most layers, the "P@8" row exhibits higher values (warmer colors: orange, yellow) concentrated in the leftmost columns (positions `8`, `0`, `0`). The "P@32" row generally shows lower values (cooler colors: dark purple, black) across the board, with occasional isolated spots of moderate value (pink/purple) in the rightmost columns (positions `16`, `7`).
* **Layer-by-Layer Analysis:**
* **Layer 0:** P@8: High values (~0.3-0.4) at positions `8`, `0`, `0`. P@32: Very low values (<0.1) across all positions.
* **Layer 1:** P@8: High values at `8`, `0`, `0`. P@32: Low values, with a slight increase at position `16`.
* **Layer 2:** P@8: A distinct, very high-value (yellow, ~0.4) cell at the 4th position (label `1`). P@32: Mostly low, with a faint purple spot at position `15`.
* **Layer 3:** P@8: High values at `8`, `0`, `0`. P@32: A band of moderate value (~0.1-0.2) across positions `8` to `1`.
* **Layer 4:** P@8: High values at `8`, `0`, `0`. P@32: Low, with a pink spot (~0.2) at position `7`.
* **Layer 5:** P@8: High values at `8`, `0`, `0`. P@32: Low, with a pink spot at position `7`.
* **Layer 6:** P@8: High values at `8`, `0`, `0`. P@32: Low, with a pink spot at position `7`.
* **Layer 7:** P@8: High values at `8`, `0`, `0`. P@32: Moderate values (~0.2-0.3) at positions `8`, `0`, and a pink spot at `7`.
* **Layer 8:** P@8: High values at `8`, `0`, `0`. P@32: Moderate values at `8`, `0`, and a pink spot at `7`.
* **Layer 9:** P@8: High values at `8`, `0`, `0`. P@32: Moderate values at `8`, `0`, and a pink spot at `7`.
* **Layer 10:** P@8: High values at `8`, `0`, `0`. P@32: A band of low-to-moderate values across the left half.
* **Layer 11:** P@8: Moderate values at `8`, `0`, `0`. P@32: A single, isolated pink spot (~0.25) at the far right position `7`.
### Key Observations
1. **Positional Bias in P@8:** The "P@8" condition shows a strong and consistent bias toward the first three positions (`8`, `0`, `0`) across nearly all layers. This suggests that when the model attends from or to position 8, it focuses heavily on these early tokens.
2. **Sparse Activation in P@32:** The "P@32" condition is characterized by generally low activation, with notable exceptions. The most common exception is a recurring spot of moderate value at the final position (`7`) in layers 4-9 and 11.
3. **Layer 2 Anomaly:** Layer 2, P@8 contains the single highest-value cell in the entire visualization (bright yellow at position `1`), indicating a unique, strong activation at this specific layer and position.
4. **Evolution Through Layers:** The pattern is not static. While the left-side bias in P@8 is constant, the specific distribution of values within those first three cells changes slightly per layer. The P@32 pattern becomes more active in the middle layers (3-9) before simplifying again in the final layers.
### Interpretation
This heatmap provides a diagnostic view of how a causal self-attention model processes information at a "PAUSE" token under two different positional contexts (P@8 and P@32). The data suggests:
* **Context-Dependent Attention:** The model's attention mechanism behaves fundamentally differently depending on the positional context. The "P@8" context triggers a strong, localized focus on a small set of early tokens, which could be crucial for resolving dependencies or maintaining state near the pause point.
* **Role of the "PAUSE" Token:** The consistent high values at positions labeled `0` (which appears twice) might indicate that the model treats the token at index 0 as particularly important when encountering a PAUSE, possibly as a anchor or reset point.
* **Functional Specialization Across Layers:** The anomaly in Layer 2 suggests that specific layers may be specialized for detecting or processing particular positional relationships. The recurring activation at position `7` in the P@32 condition for mid-to-late layers might indicate a learned pattern for handling longer-range dependencies or sequence endings.
* **Implication for Model Design:** The stark contrast between P@8 and P@32 patterns highlights the significant impact of absolute positional encoding on attention. This could inform architectural choices, suggesting that different positional schemes might be needed for different parts of a sequence or different tasks. The visualization acts as a "fMRI" for the model's attention, revealing where it "looks" and how that gaze changes with depth and context.
DECODING INTELLIGENCE...