TECHNICAL ASSET FINGERPRINT
7e8a0d70f157ca4cc08247c2
Click to view fullscreen
Press ESC or click to close
FOUND IN PAPERS
EXPERT: healer-alpha-free VERSION 1
RUNTIME: free/openrouter/healer-alpha
INTEL_VERIFIED
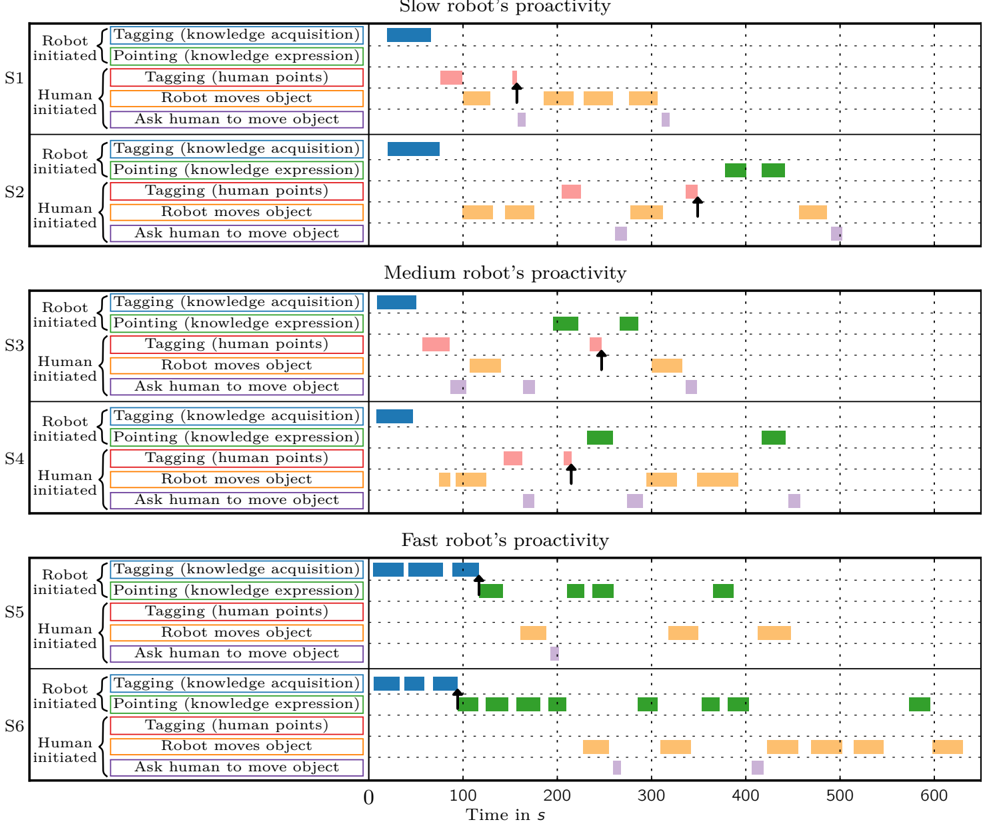
## Timeline Diagram: Robot-Human Interaction Proactivity Levels
### Overview
The image displays a series of six timeline charts (labeled S1 through S6) organized into three main sections based on the robot's proactivity level: "Slow robot's proactivity," "Medium robot's proactivity," and "Fast robot's proactivity." Each chart visualizes the temporal occurrence of specific actions initiated by either a robot or a human over a 600-second period. The charts use color-coded horizontal bars to represent discrete action events.
### Components/Axes
* **Main Sections (Top to Bottom):**
* Slow robot's proactivity (Contains panels S1 and S2)
* Medium robot's proactivity (Contains panels S3 and S4)
* Fast robot's proactivity (Contains panels S5 and S6)
* **X-Axis (Common to all panels):** Labeled "Time in s" at the bottom of the entire figure. It spans from 0 to 600 seconds, with major tick marks and labels at 0, 100, 200, 300, 400, 500, and 600. A dotted vertical grid aligns with these ticks.
* **Panel Structure (S1-S6):** Each panel is a self-contained timeline. The left side of each panel contains a legend defining the action categories.
* **Legend (Embedded in each panel, left side):** Actions are grouped by initiator.
* **Robot initiated:**
* `Tagging (knowledge acquisition)` - Blue bar
* `Pointing (knowledge expression)` - Green bar
* **Human initiated:**
* `Tagging (human points)` - Pink bar
* `Robot moves object` - Orange bar
* `Ask human to move object` - Purple bar
* **Annotations:** Small black upward-pointing arrows (↑) appear in panels S1, S2, S3, S4, and S5, indicating specific moments in time.
### Detailed Analysis
**Panel S1 (Slow Proactivity):**
* **Robot Actions:** A single, short blue `Tagging` event occurs near t=0s. No green `Pointing` events.
* **Human Actions:** A pink `Tagging` event occurs around t=120s. Multiple orange `Robot moves object` events are scattered between ~t=150s and t=350s. A single purple `Ask human to move object` event occurs near t=320s.
* **Trend:** Sparse robot activity. Human actions are intermittent, with object movement being the most frequent human-initiated action.
**Panel S2 (Slow Proactivity):**
* **Robot Actions:** A single blue `Tagging` event near t=0s. Two green `Pointing` events occur between t=400s and t=450s.
* **Human Actions:** A pink `Tagging` event near t=220s. Orange `Robot moves object` events occur in three clusters: ~t=100-150s, ~t=280-320s, and a single event near t=480s. Two purple `Ask human to move object` events occur near t=260s and t=500s.
* **Trend:** Similar to S1, with delayed and infrequent robot pointing. Human object movement requests are more clustered.
**Panel S3 (Medium Proactivity):**
* **Robot Actions:** A single blue `Tagging` event near t=0s. Two green `Pointing` events occur between t=200s and t=250s.
* **Human Actions:** A pink `Tagging` event near t=100s. Orange `Robot moves object` events occur near t=130s and t=320s. Three purple `Ask human to move object` events occur near t=80s, t=180s, and t=350s.
* **Trend:** Robot pointing occurs earlier than in the Slow condition. Human actions are more evenly distributed.
**Panel S4 (Medium Proactivity):**
* **Robot Actions:** A single blue `Tagging` event near t=0s. Two green `Pointing` events occur near t=250s and t=420s.
* **Human Actions:** A pink `Tagging` event near t=180s. A cluster of orange `Robot moves object` events occurs between t=80-120s, with another cluster between t=300-400s. Two purple `Ask human to move object` events occur near t=100s and t=280s.
* **Trend:** Robot pointing is delayed. Human object movement requests are highly clustered in two distinct periods.
**Panel S5 (Fast Proactivity):**
* **Robot Actions:** Three blue `Tagging` events occur in quick succession between t=0-100s. Three green `Pointing` events occur between t=100-250s, with another near t=380s.
* **Human Actions:** A single pink `Tagging` event near t=180s. Orange `Robot moves object` events occur near t=320s and t=420s. A single purple `Ask human to move object` event occurs near t=200s.
* **Trend:** Marked increase in robot-initiated actions (both tagging and pointing), especially early in the timeline. Human-initiated actions are less frequent.
**Panel S6 (Fast Proactivity):**
* **Robot Actions:** Three blue `Tagging` events occur between t=0-100s. A dense series of green `Pointing` events occurs throughout the timeline, with clusters near t=100-200s, t=300-400s, and a final event near t=580s.
* **Human Actions:** No pink `Tagging` events. Orange `Robot moves object` events occur in a long cluster from ~t=250s to t=600s. Two purple `Ask human to move object` events occur near t=260s and t=410s.
* **Trend:** Highest density of robot actions, with pointing being very frequent. Human activity is dominated by a sustained period of requesting object movement in the latter half of the session.
### Key Observations
1. **Proactivity Gradient:** There is a clear visual increase in the frequency and earlier onset of robot-initiated actions (blue and green bars) from the Slow to Fast sections.
2. **Action Sequencing:** In all panels, robot `Tagging (knowledge acquisition)` (blue) is the first action, occurring at or near t=0s.
3. **Human Response Pattern:** Human `Tagging (human points)` (pink) typically occurs after the initial robot tagging. The frequency of human `Ask human to move object` (purple) appears relatively stable across conditions, while `Robot moves object` (orange) shows more variability in clustering.
4. **Arrow Annotations:** The black upward arrows (↑) consistently appear immediately following a human `Tagging (human points)` (pink) event in panels S1, S2, S3, and S4. In S5, the arrow follows a robot `Pointing` event. This suggests the arrow marks a significant event or trigger point in the interaction sequence.
5. **Temporal Clustering:** Human-initiated `Robot moves object` (orange) actions show strong temporal clustering, especially in S4 and S6, indicating periods of concentrated activity.
### Interpretation
This diagram illustrates the results of an experiment or observation studying how a robot's level of proactivity (Slow, Medium, Fast) influences the temporal dynamics of a collaborative task with a human. The data suggests that:
* **Increased Robot Proactivity Leads to Earlier and More Frequent Robot Initiatives:** The "Fast" condition is characterized by the robot performing knowledge acquisition (tagging) and expression (pointing) actions sooner and more often. This likely represents a robot that is more assertive in sharing information or guiding the task.
* **Human Behavior Adapts to Robot Pace:** In the Fast condition (S5, S6), human-initiated tagging is reduced or absent, and human requests for object movement become more sustained (S6). This could indicate the human is following the robot's lead more closely or that the robot's high proactivity reduces the need for the human to initiate certain actions.
* **The Interaction is Structured Around Key Events:** The consistent placement of the black arrow after a human tagging event (in most panels) implies this action is a critical juncture, possibly triggering a change in the robot's behavior or the task phase. The exception in S5 (arrow after robot pointing) may indicate a shift in dynamics under high robot proactivity.
* **Collaboration Rhythm:** The clustering of human "move object" requests suggests the task has phases of object manipulation. The robot's proactivity level appears to affect the timing and density of these phases, not just the robot's own actions.
In essence, the chart provides a visual proof that tuning a robot's proactivity parameter significantly alters the choreography of human-robot interaction, affecting when and how often each agent contributes to the shared task.
DECODING INTELLIGENCE...