## Diagram: Point Distribution and Clustering
### Overview
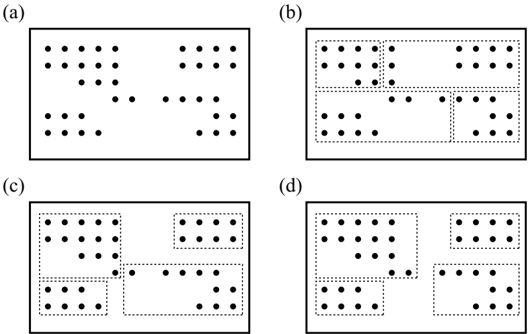
The image presents four diagrams (a, b, c, d) illustrating the distribution of points within a rectangular area. Diagrams (b), (c), and (d) show different ways of clustering these points using dashed-line rectangles.
### Components/Axes
* **Diagrams:** (a), (b), (c), (d)
* **Points:** Represented by small black circles.
* **Clustering:** Indicated by dashed-line rectangles in diagrams (b), (c), and (d).
### Detailed Analysis
**Diagram (a):**
* Shows the initial distribution of points.
* There are approximately 35 points in total.
* The points are grouped into several clusters:
* A cluster of 9 points in the top-left.
* A cluster of 9 points in the top-right.
* A cluster of 6 points in the bottom-left.
* A cluster of 6 points in the bottom-right.
* A linear cluster of 5 points in the center.
**Diagram (b):**
* Shows a clustering of the points from diagram (a).
* The points are grouped into three clusters:
* A cluster of 9 points in the top-left.
* A cluster of 9 points in the top-right.
* A cluster of 17 points in the bottom.
**Diagram (c):**
* Shows a different clustering of the points from diagram (a).
* The points are grouped into three clusters:
* A cluster of 9 points in the top-left.
* A cluster of 6 points in the bottom-left.
* A cluster of 11 points in the right.
**Diagram (d):**
* Shows a different clustering of the points from diagram (a).
* The points are grouped into three clusters:
* A cluster of 9 points in the top-left.
* A cluster of 6 points in the bottom-left.
* A cluster of 11 points in the right.
### Key Observations
* Diagram (a) serves as the baseline, showing the initial point distribution.
* Diagrams (b), (c), and (d) demonstrate different approaches to clustering the same set of points.
* The number of points remains constant across all diagrams; only the clustering changes.
### Interpretation
The diagrams illustrate different ways to group or cluster data points. Diagram (a) shows the raw data, while diagrams (b), (c), and (d) show different interpretations of the data through clustering. The choice of clustering method depends on the specific application and the desired outcome. The image demonstrates that the same data can be organized and interpreted in multiple ways.