## Chart: Test Accuracy vs. Communication Round for FedProto and FedMRL
### Overview
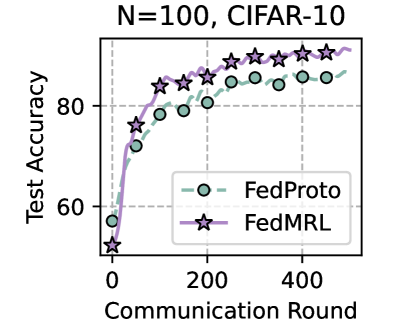
The image is a line chart comparing the test accuracy of two federated learning algorithms, FedProto and FedMRL, over a number of communication rounds. The chart displays the performance of these algorithms on the CIFAR-10 dataset with N=100.
### Components/Axes
* **Title:** N=100, CIFAR-10
* **X-axis:** Communication Round, with ticks at 0, 200, 400. The x-axis represents the number of communication rounds.
* **Y-axis:** Test Accuracy, with ticks at 60, 80. The y-axis represents the test accuracy in percentage.
* **Legend:** Located in the bottom-right of the chart.
* FedProto: Represented by a dashed light green line with circle markers.
* FedMRL: Represented by a solid light purple line with star markers.
* **Grid:** The chart has a light gray dashed grid.
### Detailed Analysis
* **FedProto (light green, dashed line with circle markers):**
* The line starts at approximately 55% accuracy at communication round 0.
* The line increases sharply until approximately round 100, reaching around 78% accuracy.
* From round 100 to 500, the line continues to increase, but at a slower rate, reaching approximately 85% accuracy.
* **FedMRL (light purple, solid line with star markers):**
* The line starts at approximately 50% accuracy at communication round 0.
* The line increases sharply until approximately round 100, reaching around 83% accuracy.
* From round 100 to 500, the line continues to increase, but at a slower rate, reaching approximately 90% accuracy.
### Key Observations
* Both algorithms show a significant increase in test accuracy during the initial communication rounds.
* FedMRL consistently outperforms FedProto throughout the communication rounds.
* The rate of improvement in test accuracy decreases as the number of communication rounds increases for both algorithms.
* The final test accuracy for FedProto is around 85%, while for FedMRL it is around 90%.
### Interpretation
The chart demonstrates that both FedProto and FedMRL are effective federated learning algorithms for the CIFAR-10 dataset. However, FedMRL achieves higher test accuracy compared to FedProto, suggesting it may be a more efficient or better-suited algorithm for this particular task and dataset. The diminishing returns in accuracy with increasing communication rounds suggest that there is a point beyond which further training provides only marginal improvements. The initial rapid increase in accuracy highlights the importance of the early communication rounds in establishing a good model.