\n
## Chart: Batch Size Scan - Training Loss Curves
### Overview
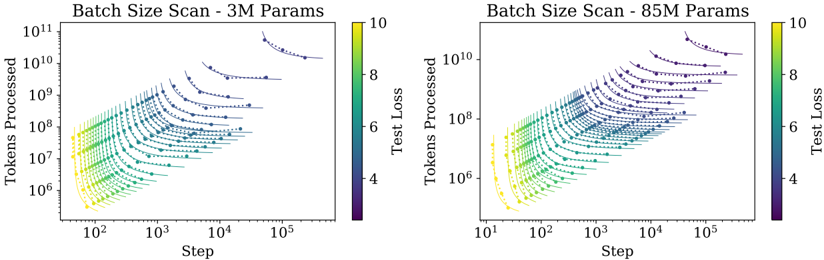
The image presents two scatter plots visualizing the relationship between 'Step' (x-axis) and 'Tokens Processed' (y-axis), colored by 'Test Loss'. The plots compare training dynamics for two model sizes: 3M parameters (left) and 85M parameters (right). Each plot displays multiple curves, likely representing different batch sizes. The color gradient indicates the 'Test Loss' value, ranging from approximately 4 to 10.
### Components/Axes
* **X-axis:** 'Step' - Logarithmic scale, ranging from approximately 10<sup>1</sup> to 10<sup>5</sup>.
* **Y-axis:** 'Tokens Processed' - Logarithmic scale, ranging from approximately 10<sup>6</sup> to 10<sup>11</sup>.
* **Colorbar:** 'Test Loss' - Linear scale, ranging from approximately 4 to 10.
* **Title (Left):** "Batch Size Scan - 3M Params"
* **Title (Right):** "Batch Size Scan - 85M Params"
* **Data Points:** Scatter plots with varying colors representing different 'Test Loss' values. Each line represents a different batch size.
### Detailed Analysis or Content Details
**Left Plot (3M Params):**
* **Trend:** The curves generally slope downwards, indicating decreasing loss as the number of steps and tokens processed increases. The initial slope is steeper for some curves than others.
* **Data Points (Approximate):**
* Several curves start around Step = 10<sup>1</sup> and Tokens Processed = 10<sup>6</sup> with a Test Loss of approximately 9-10 (yellow/red).
* As Step increases to 10<sup>2</sup>, Tokens Processed increases to around 10<sup>7</sup>-10<sup>8</sup>, and Test Loss decreases to approximately 6-8 (orange/yellow).
* At Step = 10<sup>3</sup>, Tokens Processed reaches approximately 10<sup>8</sup>-10<sup>9</sup>, and Test Loss decreases to approximately 4-6 (green/yellow).
* By Step = 10<sup>4</sup>-10<sup>5</sup>, Tokens Processed reaches 10<sup>9</sup>-10<sup>10</sup>, and Test Loss stabilizes around 4-5 (blue/green).
* A few curves exhibit a more rapid initial decrease in loss, suggesting potentially larger batch sizes.
**Right Plot (85M Params):**
* **Trend:** Similar to the 3M parameter plot, the curves generally slope downwards. However, the initial slopes are generally less steep, and the curves appear more spread out.
* **Data Points (Approximate):**
* Curves start around Step = 10<sup>1</sup> and Tokens Processed = 10<sup>6</sup> with a Test Loss of approximately 9-10 (yellow/red).
* As Step increases to 10<sup>2</sup>, Tokens Processed increases to around 10<sup>7</sup>-10<sup>8</sup>, and Test Loss decreases to approximately 6-8 (orange/yellow).
* At Step = 10<sup>3</sup>, Tokens Processed reaches approximately 10<sup>8</sup>-10<sup>9</sup>, and Test Loss decreases to approximately 4-6 (green/yellow).
* By Step = 10<sup>4</sup>-10<sup>5</sup>, Tokens Processed reaches 10<sup>9</sup>-10<sup>10</sup>, and Test Loss stabilizes around 4-5 (blue/green).
* There is a greater variance in the final Test Loss values across different batch sizes in this plot.
### Key Observations
* The 85M parameter model appears to require more steps and tokens processed to achieve a similar level of loss reduction compared to the 3M parameter model.
* The spread of curves in the 85M parameter plot suggests a greater sensitivity to batch size.
* The colorbar consistently maps lower Test Loss values to cooler colors (blue/green) and higher values to warmer colors (yellow/red) in both plots.
* The logarithmic scales on both axes are crucial for visualizing the wide range of values.
### Interpretation
These plots demonstrate the impact of batch size on the training dynamics of neural networks with different parameter counts. The 'Test Loss' color coding allows for a visual assessment of how different batch sizes affect the model's generalization performance. The 85M parameter model's greater sensitivity to batch size suggests that careful tuning of this hyperparameter is particularly important for larger models. The slower initial loss reduction in the 85M parameter model could be attributed to the increased complexity and the need for more data to effectively train the larger number of parameters. The plots suggest that, for both model sizes, increasing the number of steps and tokens processed generally leads to lower test loss, but the optimal batch size varies and impacts the training trajectory. The use of a logarithmic scale is essential to visualize the data effectively, as the ranges of 'Step' and 'Tokens Processed' are quite large.