## Line Chart: Success Rate vs. Number of Actions
### Overview
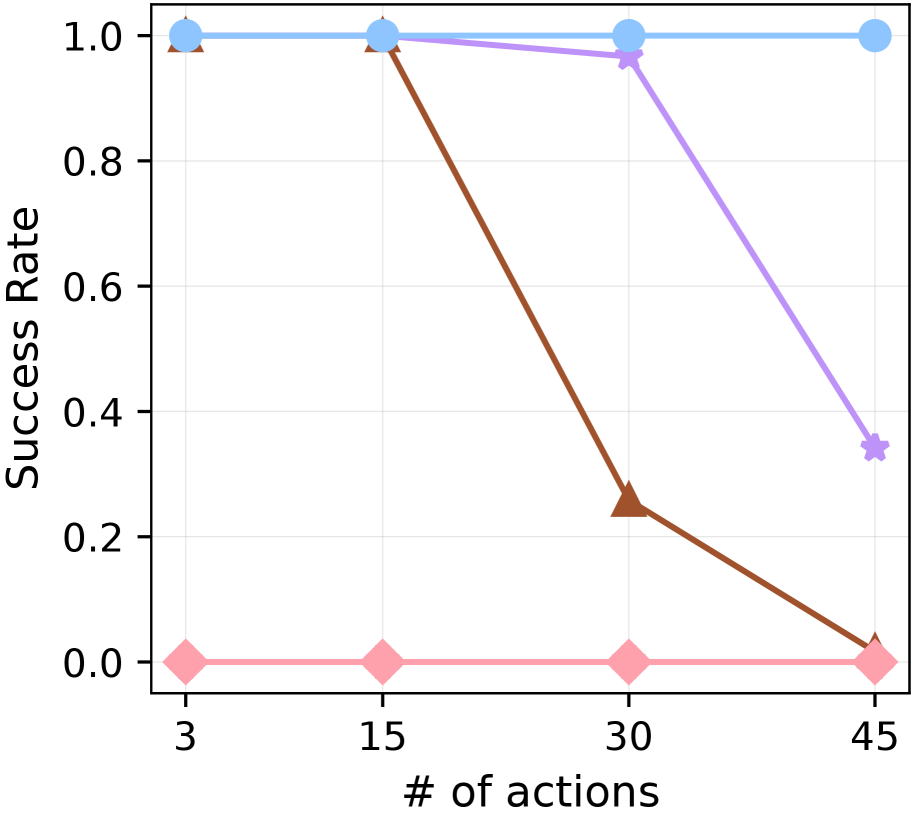
The image is a line chart plotting "Success Rate" against the "# of actions". It displays the performance of four distinct series, differentiated by color and marker shape, as the number of actions increases from 3 to 45. The chart suggests an analysis of how task complexity (proxied by action count) affects the success rate of different methods or agents.
### Components/Axes
* **X-Axis (Horizontal):**
* **Label:** "# of actions"
* **Scale/Markers:** The axis has four discrete, labeled tick marks: `3`, `15`, `30`, and `45`.
* **Y-Axis (Vertical):**
* **Label:** "Success Rate"
* **Scale/Markers:** The axis ranges from `0.0` to `1.0`, with labeled increments at `0.0`, `0.2`, `0.4`, `0.6`, `0.8`, and `1.0`.
* **Data Series (Legend inferred from visual attributes):**
1. **Light Blue Line with Circle Markers:** Positioned at the top of the chart.
2. **Purple Line with Star Markers:** Starts near the top, then declines.
3. **Brown Line with Triangle Markers:** Starts near the top, then declines sharply.
4. **Pink Line with Diamond Markers:** Positioned at the bottom of the chart.
* **Spatial Layout:** The chart area is bounded by a black frame. The x-axis label is centered at the bottom. The y-axis label is rotated 90 degrees and centered on the left side. The data lines are plotted within the grid defined by the axes.
### Detailed Analysis
**Trend Verification & Data Point Extraction:**
1. **Light Blue Line (Circle Markers):**
* **Trend:** Perfectly flat, horizontal line at the maximum success rate.
* **Data Points:**
* At # actions = 3: Success Rate ≈ 1.0
* At # actions = 15: Success Rate ≈ 1.0
* At # actions = 30: Success Rate ≈ 1.0
* At # actions = 45: Success Rate ≈ 1.0
2. **Purple Line (Star Markers):**
* **Trend:** Maintains a high success rate initially, then experiences a significant decline between 30 and 45 actions.
* **Data Points:**
* At # actions = 3: Success Rate ≈ 1.0
* At # actions = 15: Success Rate ≈ 1.0
* At # actions = 30: Success Rate ≈ 0.97 (slightly below 1.0)
* At # actions = 45: Success Rate ≈ 0.35
3. **Brown Line (Triangle Markers):**
* **Trend:** Starts high but shows a steep, consistent decline as the number of actions increases.
* **Data Points:**
* At # actions = 3: Success Rate ≈ 1.0
* At # actions = 15: Success Rate ≈ 1.0
* At # actions = 30: Success Rate ≈ 0.25
* At # actions = 45: Success Rate ≈ 0.02 (very close to 0.0)
4. **Pink Line (Diamond Markers):**
* **Trend:** Perfectly flat, horizontal line at the minimum success rate.
* **Data Points:**
* At # actions = 3: Success Rate ≈ 0.0
* At # actions = 15: Success Rate ≈ 0.0
* At # actions = 30: Success Rate ≈ 0.0
* At # actions = 45: Success Rate ≈ 0.0
### Key Observations
* **Performance Stratification:** The chart shows four distinct performance tiers. One method (light blue) is perfectly robust, one (pink) fails completely, and two (purple, brown) degrade with increased task complexity.
* **Critical Threshold:** For the degrading methods, the performance drop is not linear. The brown line begins its sharp decline after 15 actions, while the purple line holds until after 30 actions, suggesting different thresholds of complexity tolerance.
* **Convergence at Extremes:** At the lowest complexity (3 actions), three of the four methods achieve perfect success. At the highest complexity (45 actions), only one method maintains perfect success, one fails completely, and the other two have low to moderate success.
### Interpretation
This chart likely compares the scalability or robustness of different algorithms, agents, or strategies on a task where success is measured by completion rate. The "# of actions" serves as a proxy for task difficulty or length.
* The **light blue series** represents a highly scalable and reliable approach that is unaffected by the tested range of task complexity.
* The **pink series** represents a baseline or ineffective approach that fails regardless of task length.
* The **brown and purple series** reveal methods that work well for simple tasks but have fundamental limitations that cause failure as tasks become more complex. The brown method appears less robust than the purple one, as its performance degrades earlier and more severely.
* The **key insight** is that method selection is critical for complex tasks. While several approaches work for simple scenarios (3-15 actions), only one (light blue) is suitable for the most complex scenario tested (45 actions). The data argues for the superiority of the light blue method in terms of scalability and reliability.