## Horizontal Bar Chart: Minimum Score at Last Step (%)
### Overview
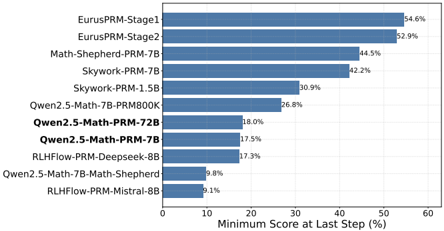
The image is a horizontal bar chart comparing the performance of 11 different AI models or training methods, measured by the "Minimum Score at Last Step (%)". The chart is sorted in descending order, with the highest-performing models at the top.
### Components/Axes
* **X-Axis:** Labeled "Minimum Score at Last Step (%)". The scale ranges from 0 to 60, with vertical grid lines at intervals of 10.
* **Y-Axis:** Lists the specific models or methods being evaluated.
* **Data Series:** Horizontal blue bars representing the percentage score for each category.
* **Annotations:** Numerical values are placed at the end of each bar, indicating the exact percentage.
### Detailed Analysis
The data is presented in descending order of performance. Below are the extracted values:
| Model/Method | Minimum Score at Last Step (%) |
| :--- | :--- |
| EurusPRM-Stage1 | 54.6% |
| EurusPRM-Stage2 | 52.9% |
| Math-Shepherd-PRM-7B | 44.5% |
| Skywork-PRM-7B | 42.2% |
| Skywork-PRM-1.5B | 30.9% |
| Qwen2.5-Math-7B-PRM800K | 26.8% |
| **Qwen2.5-Math-PRM-72B** | 18.0% |
| **Qwen2.5-Math-PRM-7B** | 17.5% |
| RLHFlow-PRM-Deepseek-8B | 17.3% |
| Qwen2.5-Math-7B-Math-Shepherd | 9.8% |
| RLHFlow-PRM-Mistral-8B | 9.1% |
*Note: The entries "Qwen2.5-Math-PRM-72B" and "Qwen2.5-Math-PRM-7B" are formatted in bold text, likely indicating they are the primary models of interest or the focus of the study.*
### Key Observations
* **Performance Tiers:** There is a clear stratification in performance. The EurusPRM models (Stage 1 and 2) significantly outperform the rest of the field, both exceeding 50%.
* **Clustering:** A tight cluster of performance is observed in the 17-18% range, consisting of Qwen2.5-Math-PRM-72B, Qwen2.5-Math-PRM-7B, and RLHFlow-PRM-Deepseek-8B.
* **Performance Drop-off:** There is a substantial performance gap between the top-tier models (EurusPRM) and the lower-tier models (Qwen2.5-Math-7B-Math-Shepherd and RLHFlow-PRM-Mistral-8B), which fall below 10%.
* **Bolded Emphasis:** The bolding of the two Qwen2.5-Math-PRM models suggests that the source document is likely evaluating these specific models against the others listed.
### Interpretation
This chart evaluates Process Reward Models (PRMs) on their ability to maintain a high "Minimum Score at the Last Step." In the context of mathematical reasoning models, this metric typically measures the reliability of the model's reasoning path—specifically, how often the model maintains a high-confidence or correct state until the final step of a solution.
The data suggests that the EurusPRM methodology is significantly more effective at this specific metric than the other listed approaches. The clustering of the Qwen2.5-Math-PRM models in the lower-middle section of the chart indicates that while they are being highlighted, they are currently underperforming compared to the Eurus and Skywork baselines in this specific evaluation. The low scores of the bottom-tier models (below 10%) suggest they struggle to maintain consistent reasoning accuracy through to the final step of the problems presented.