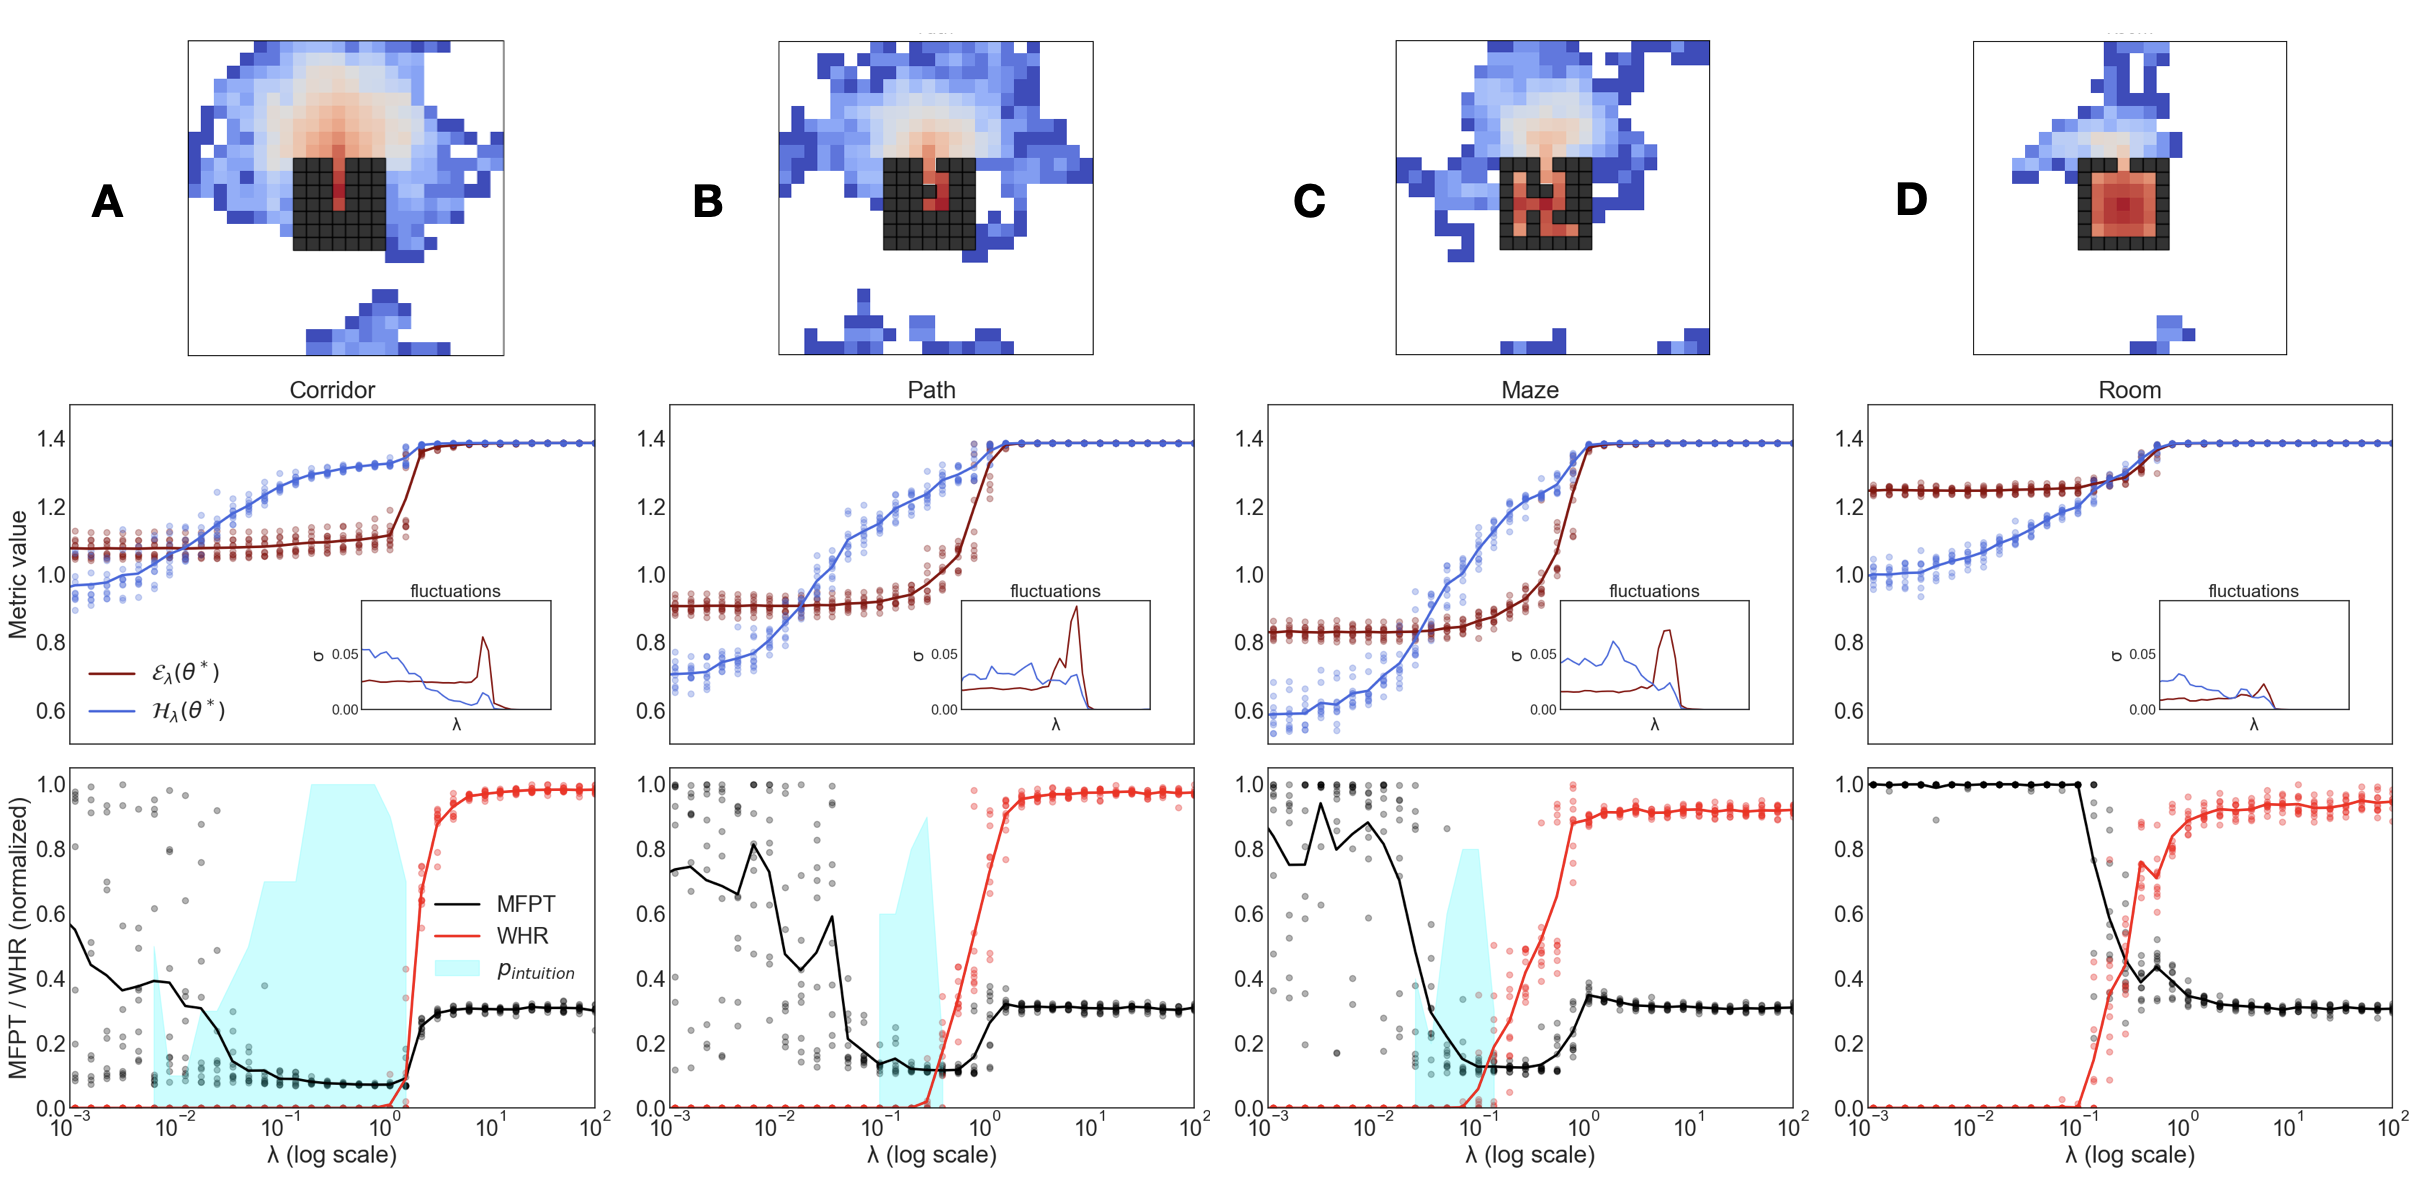
## Chart/Diagram Type: Multi-Panel Plot of Agent Navigation and Performance Metrics
### Overview
The image presents a multi-panel plot analyzing agent navigation in different environments. It consists of four columns (A, B, C, D) representing different environments: Corridor, Path, Maze, and Room. Each column contains three subplots: a heatmap of agent visitation, a plot of metric values (Eλ(θ*) and Hλ(θ*)) vs. λ (log scale), and a plot of MFPT/WHR (normalized) vs. λ (log scale). The plots analyze how different metrics change with varying values of λ, providing insights into the agent's performance and behavior in each environment.
### Components/Axes
**Overall Structure:**
* Four columns labeled A, B, C, and D, representing different environments.
* Each column has three subplots stacked vertically.
**Top Row (Heatmaps):**
* Each heatmap shows the agent's visitation frequency in the environment.
* Color scale: Blue (low visitation) to Red (high visitation).
* A black square represents the goal location.
**Middle Row (Metric Value vs. λ):**
* Y-axis: "Metric value", ranging from 0.6 to 1.4.
* X-axis: "λ (log scale)", ranging from approximately 10^-3 to 10^2.
* Two data series:
* Eλ(θ*) - Red line
* Hλ(θ*) - Blue line
* Inset plot labeled "fluctuations" with axes ranging from 0.00 to 0.05 on the y-axis and an unlabeled x-axis.
**Bottom Row (MFPT/WHR vs. λ):**
* Y-axis: "MFPT / WHR (normalized)", ranging from 0.0 to 1.0.
* X-axis: "λ (log scale)", ranging from approximately 10^-3 to 10^2.
* Three data series:
* MFPT - Black line with markers
* WHR - Red line
* Pintuition - Light blue shaded region
**Labels:**
* Column A: "Corridor"
* Column B: "Path"
* Column C: "Maze"
* Column D: "Room"
### Detailed Analysis
**Column A: Corridor**
* **Heatmap:** High visitation near the starting point and the goal location.
* **Eλ(θ*) (Red):** Starts around 1.1, remains relatively constant, then increases sharply to approximately 1.35 around λ = 10^0.
* **Hλ(θ*) (Blue):** Starts around 0.8, increases gradually to approximately 1.4.
* **MFPT (Black):** Starts around 0.4, decreases to a minimum around 0.1 at λ = 10^-1, then increases slightly.
* **WHR (Red):** Starts near 0, increases sharply to 1.0 around λ = 10^0.
* **Pintuition (Light Blue):** A broad peak between λ = 10^-2 and λ = 10^0.
**Column B: Path**
* **Heatmap:** High visitation along a direct path to the goal.
* **Eλ(θ*) (Red):** Starts around 0.8, remains relatively constant, then increases sharply to approximately 1.35 around λ = 10^0.
* **Hλ(θ*) (Blue):** Starts around 0.6, increases gradually to approximately 1.4.
* **MFPT (Black):** Starts around 0.8, decreases to a minimum around 0.15 at λ = 10^-1, then increases slightly.
* **WHR (Red):** Starts near 0, increases sharply to 1.0 around λ = 10^0.
* **Pintuition (Light Blue):** A peak between λ = 10^-2 and λ = 10^0.
**Column C: Maze**
* **Heatmap:** High visitation in the center and near the goal, with some exploration of the maze structure.
* **Eλ(θ*) (Red):** Starts around 0.8, remains relatively constant, then increases sharply to approximately 1.35 around λ = 10^0.
* **Hλ(θ*) (Blue):** Starts around 0.6, increases gradually to approximately 1.4.
* **MFPT (Black):** Starts around 0.9, decreases to a minimum around 0.15 at λ = 10^-1, then increases slightly.
* **WHR (Red):** Starts near 0, increases sharply to 1.0 around λ = 10^0.
* **Pintuition (Light Blue):** A peak between λ = 10^-2 and λ = 10^0.
**Column D: Room**
* **Heatmap:** High visitation concentrated near the goal location.
* **Eλ(θ*) (Red):** Starts around 1.25, remains relatively constant at approximately 1.35.
* **Hλ(θ*) (Blue):** Starts around 1.0, increases gradually to approximately 1.4.
* **MFPT (Black):** Starts around 0.8, decreases to a minimum around 0.3 at λ = 10^-1, then increases slightly.
* **WHR (Red):** Starts near 0, increases sharply to 1.0 around λ = 10^0.
* **Pintuition (Light Blue):** A peak between λ = 10^-2 and λ = 10^0.
### Key Observations
* **Heatmaps:** The agent's exploration strategy varies across environments. In the Corridor and Path, the agent quickly finds the goal. In the Maze, there's more exploration. In the Room, the agent focuses on the goal area.
* **Eλ(θ*) and Hλ(θ*):** Both metrics generally increase with λ, with a sharp increase around λ = 10^0. The initial values and the rate of increase differ slightly across environments.
* **MFPT and WHR:** The MFPT (Mean First Passage Time) generally decreases as λ increases up to a certain point, then slightly increases. The WHR (Win-stay-lose-shift Heuristic Ratio) increases sharply around λ = 10^0, indicating a shift in strategy.
* **Pintuition:** The "intuition" region is consistently located between λ = 10^-2 and λ = 10^0 across all environments.
### Interpretation
The data suggests that the agent's navigation strategy is influenced by the environment's complexity and the value of λ. The heatmaps show how the agent explores each environment, while the metric plots quantify the agent's performance. The sharp increase in WHR around λ = 10^0 indicates a transition from a more exploratory to a more exploitative strategy. The "intuition" region highlights a range of λ values where the agent's performance is likely driven by a balance between exploration and exploitation. The differences in the initial values and rates of change of Eλ(θ*) and Hλ(θ*) across environments suggest that the agent's internal model adapts to the specific characteristics of each environment.