## Dual-Axis Line Chart: Token Length and Reproduced Rate vs. RL Training Steps
### Overview
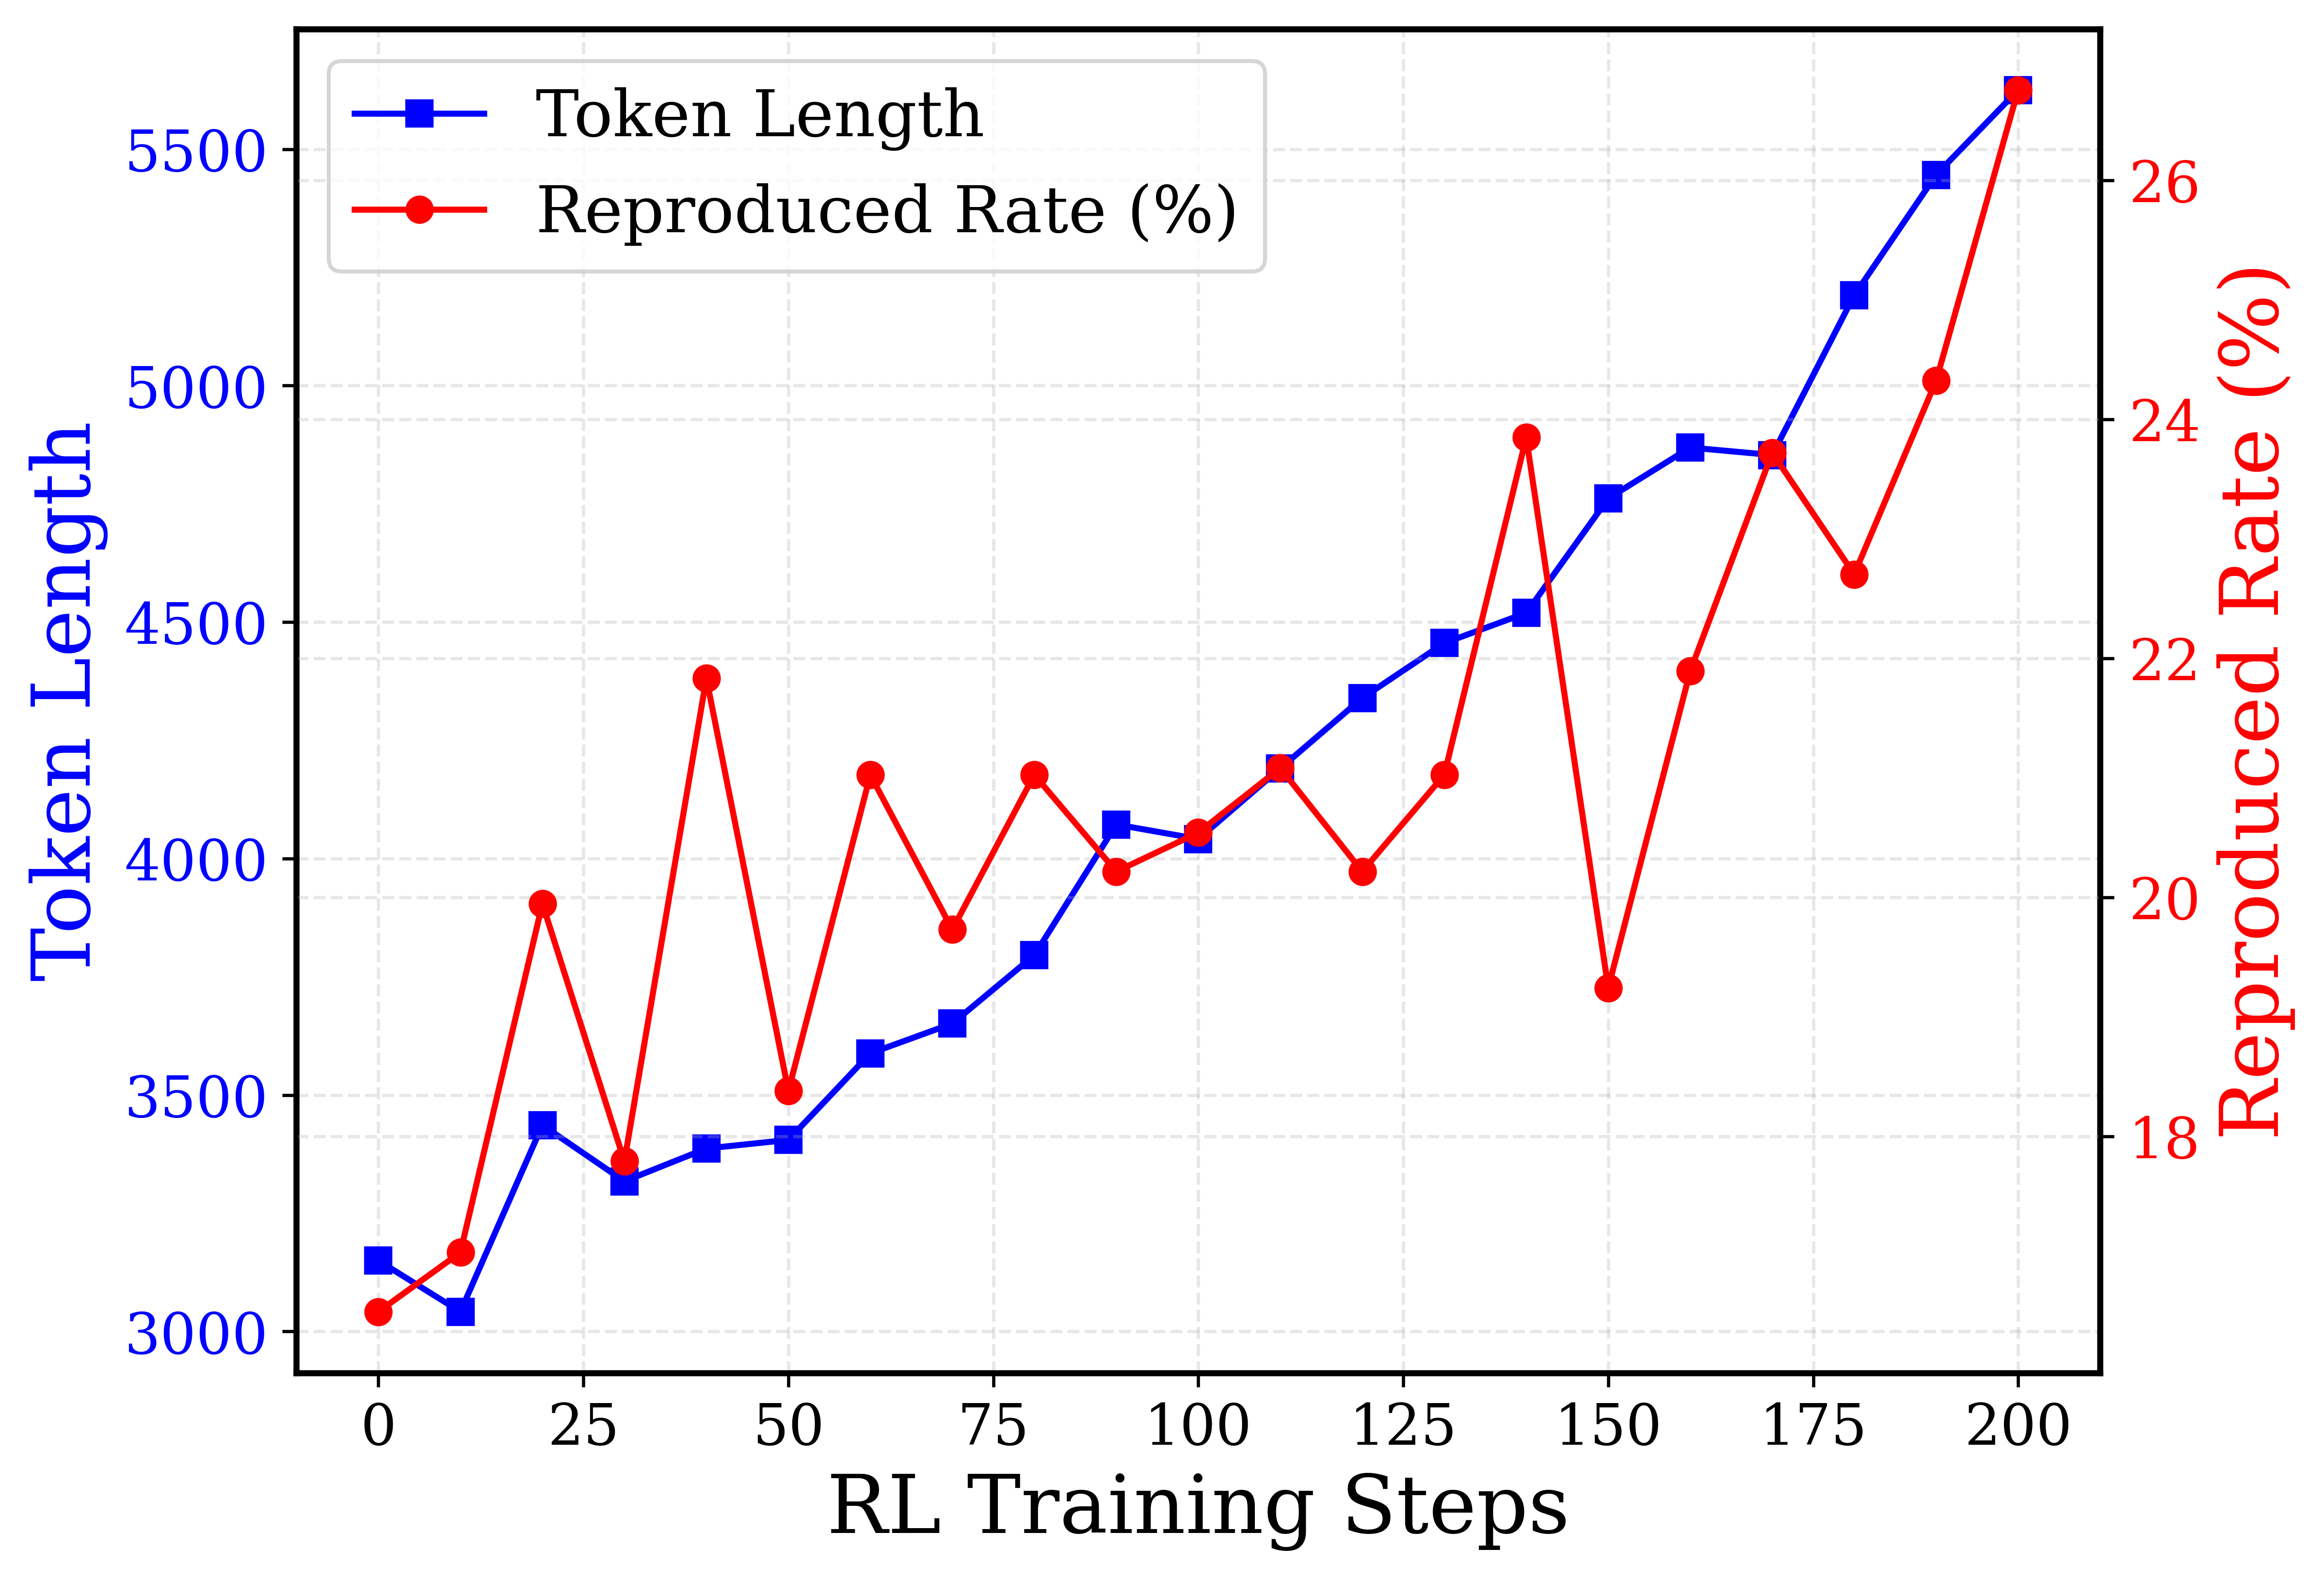
This image is a dual-axis line chart displaying the progression of two metrics—"Token Length" and "Reproduced Rate (%)"—over a series of "RL Training Steps". The chart uses a light grey dashed grid for visual guidance. The language used in the chart is entirely English.
### Components Isolation and Axes Details
**1. Header/Legend Region (Top-Left)**
* Located in the top-left corner, enclosed in a rounded rectangular border.
* **Item 1:** A solid blue line with a blue square marker. Text label: "Token Length".
* **Item 2:** A solid red line with a red circular marker. Text label: "Reproduced Rate (%)".
**2. X-Axis (Bottom)**
* **Label:** "RL Training Steps" (Centered, black text).
* **Scale:** Linear.
* **Markers/Ticks:** 0, 25, 50, 75, 100, 125, 150, 175, 200.
* *Note:* While major ticks are every 25 steps, the data points are plotted at intervals of 10 steps (0, 10, 20, 30, etc.).
**3. Left Y-Axis (Left Edge)**
* **Label:** "Token Length" (Centered vertically, rotated 90 degrees counter-clockwise, blue text).
* **Scale:** Linear.
* **Markers/Ticks:** 3000, 3500, 4000, 4500, 5000, 5500. (Blue text).
* **Association:** Corresponds to the blue line with square markers.
**4. Right Y-Axis (Right Edge)**
* **Label:** "Reproduced Rate (%)" (Centered vertically, rotated 90 degrees clockwise, red text).
* **Scale:** Linear.
* **Markers/Ticks:** 18, 20, 22, 24, 26. (Red text). There are faint grid lines indicating intermediate integer values (19, 21, 23, 25).
* **Association:** Corresponds to the red line with circular markers.
---
### Detailed Analysis & Data Extraction
#### Trend Verification
* **Token Length (Blue Line/Squares):** The visual trend shows a relatively stable, slightly fluctuating beginning between steps 0 and 50. From step 50 onwards, the line slopes upward consistently, with the rate of increase accelerating significantly after step 150.
* **Reproduced Rate (Red Line/Circles):** The visual trend is highly volatile. It exhibits sharp peaks and deep valleys throughout the training process. Despite the high variance, the overall macro-trend is upward, starting below the 18% mark and ending near the 27% mark.
#### Reconstructed Data Table
*Values are approximate (denoted by ~) based on visual alignment with the respective axes. Data points occur every 10 steps.*
| RL Training Steps (X) | Token Length (Left Y, Blue) | Reproduced Rate (%) (Right Y, Red) |
| :--- | :--- | :--- |
| 0 | ~3150 | ~16.5 |
| 10 | ~3050 | ~17.0 |
| 20 | ~3450 | ~20.0 |
| 30 | ~3300 | ~17.8 |
| 40 | ~3400 | ~21.8 |
| 50 | ~3400 | ~18.4 |
| 60 | ~3600 | ~21.0 |
| 70 | ~3650 | ~19.8 |
| 80 | ~3800 | ~21.0 |
| 90 | ~4050 | ~20.2 |
| 100 | ~4050 | ~20.6 |
| 110 | ~4200 | ~21.1 |
| 120 | ~4350 | ~20.3 |
| 130 | ~4450 | ~21.0 |
| 140 | ~4500 | ~23.8 |
| 150 | ~4750 | ~19.3 |
| 160 | ~4850 | ~22.0 |
| 170 | ~4850 | ~23.8 |
| 180 | ~5200 | ~22.8 |
| 190 | ~5450 | ~24.4 |
| 200 | ~5650 | ~26.8 |
---
### Key Observations
1. **Divergent Volatility:** The Token Length (blue) grows in a relatively smooth, exponential-looking curve. In stark contrast, the Reproduced Rate (red) is highly erratic, swinging by as much as 4-5% within a span of 10 training steps (e.g., from step 140 to 150).
2. **Correlated End-State:** Despite the differing volatility, both metrics reach their absolute maximum values at the final recorded training step (Step 200).
3. **Notable Anomalies:**
* At Step 150, there is a significant divergence: Token Length jumps up, while Reproduced Rate suffers a massive drop (from ~23.8% down to ~19.3%).
* Between Steps 90 and 130, the Reproduced Rate stabilizes somewhat (hovering tightly between 20% and 21%) while Token Length continues its steady climb.
---
### Interpretation
**Contextual Meaning:**
This chart likely represents the training dynamics of a Large Language Model (LLM) undergoing Reinforcement Learning (RL), possibly Reinforcement Learning from Human Feedback (RLHF).
* **Token Length** represents the verbosity of the model—how many words/tokens it generates in its responses.
* **Reproduced Rate (%)** likely measures how much of the model's output is directly copied or memorized from its training data or the prompt itself (often a metric used to track plagiarism, memorization, or lack of novelty).
**Reading Between the Lines (Peircean Investigative Analysis):**
The data suggests a common phenomenon in RL training: **Reward Hacking or Mode Collapse.**
As the RL training progresses (steps 0 to 200), the model is likely being rewarded for providing more detailed, comprehensive answers, which drives the "Token Length" up smoothly and consistently.
However, the model appears to be achieving this longer length not by generating novel reasoning, but by increasingly regurgitating known text. The overall upward trend of the "Reproduced Rate" indicates that as the model is forced to talk more (higher token length), it relies more heavily on memorized data.
The extreme volatility of the red line suggests the RL optimization landscape for "originality" is highly unstable. The optimizer finds a policy that generates long, highly reproduced text (e.g., Step 140), the algorithm penalizes it or shifts, resulting in a sudden drop in reproduction (Step 150), but the underlying pressure to generate long text eventually forces the reproduction rate back up to its highest point by Step 200.
Ultimately, this chart demonstrates a negative side-effect of the training run: the model is becoming much more verbose, but at the cost of becoming significantly less original.